29 Ratio Scales Survey Questions Examples
Explore 25 keyword ratio scales survey questions examples with clear sample questions, practical insights, and easy tips for better survey design.
When you want survey answers that measure real amounts, ratio scale questions do the heavy lifting. They use numbers with equal intervals and a true zero, so you can compare answers in a meaningful way, like saying one result is twice as much as another.
Here’s the thing: that makes them different from interval, ordinal, and nominal questions, which cannot all make that claim without getting mathematically wobbly. In this article, you’ll get practical examples by survey type, when to use them, sample questions, and smart ways to analyze responses for better decisions with an online survey tool.
What Are Ratio Scale Survey Questions?
Sample questions
How many times did you use the product this week?
How many minutes did it take you to complete checkout?
How much did you spend on your last order?
How many support tickets did your team submit this month?
Precise measurement starts here
Ratio scale survey questions ask you to respond with a real number that measures an amount, not just an opinion.
That matters because ratio scales have three defining traits, and yes, this is where the math earns its coffee.
They have a true zero, which means zero actually means none, like zero purchases or zero minutes.
They use equal intervals, so the gap between 1 and 2 is the same as the gap between 10 and 11.
They support arithmetic, which means you can calculate averages, percentages, differences, and ratios without things getting weird.
Here’s the thing: that makes ratio questions incredibly useful when you want precise survey measurement instead of a general vibe check.
For business surveys, they often measure concrete things like:
time
money
quantity
frequency
distance
counts
A quick way to spot the difference is this: “How satisfied are you?” measures a feeling, while “How many times did you use the product this week?” measures a count.
Plus, count-based questions give you cleaner data for analysis, forecasting, and comparisons.
If you want answers you can total, average, and confidently act on, ratio scale questions are a very smart pick.
Ratio-scale survey questions capture quantities with equal intervals and a true zero, enabling meaningful averages and ratio comparisons for measures like time, spending, and usage counts (source).

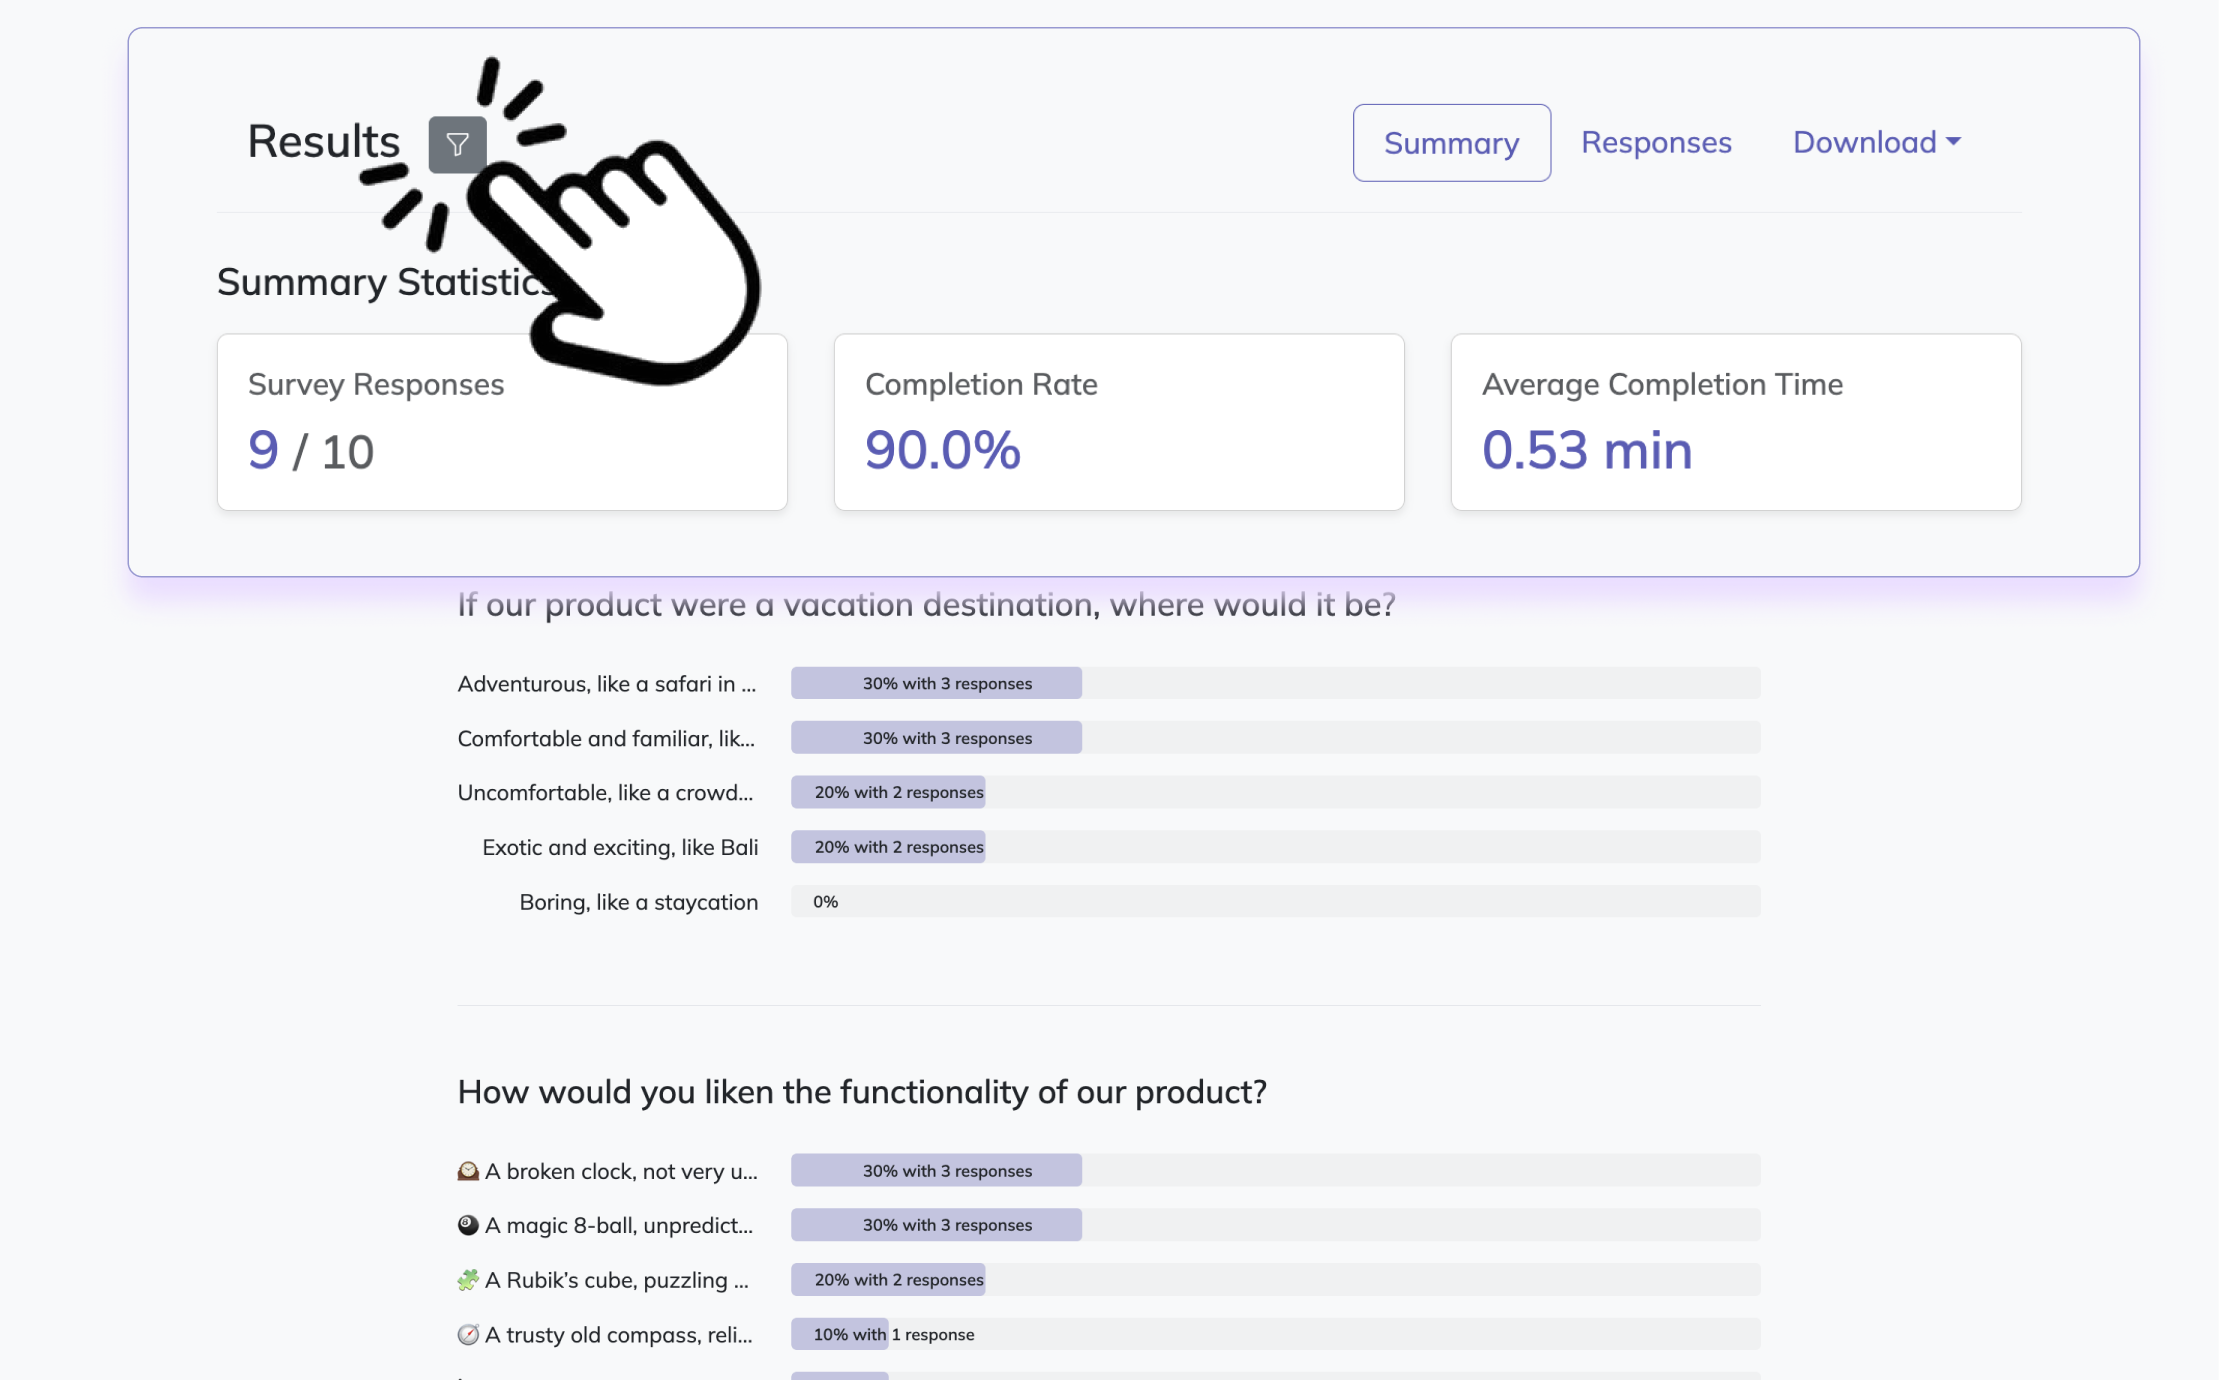
How to create ratio scales survey questions in HeySurvey
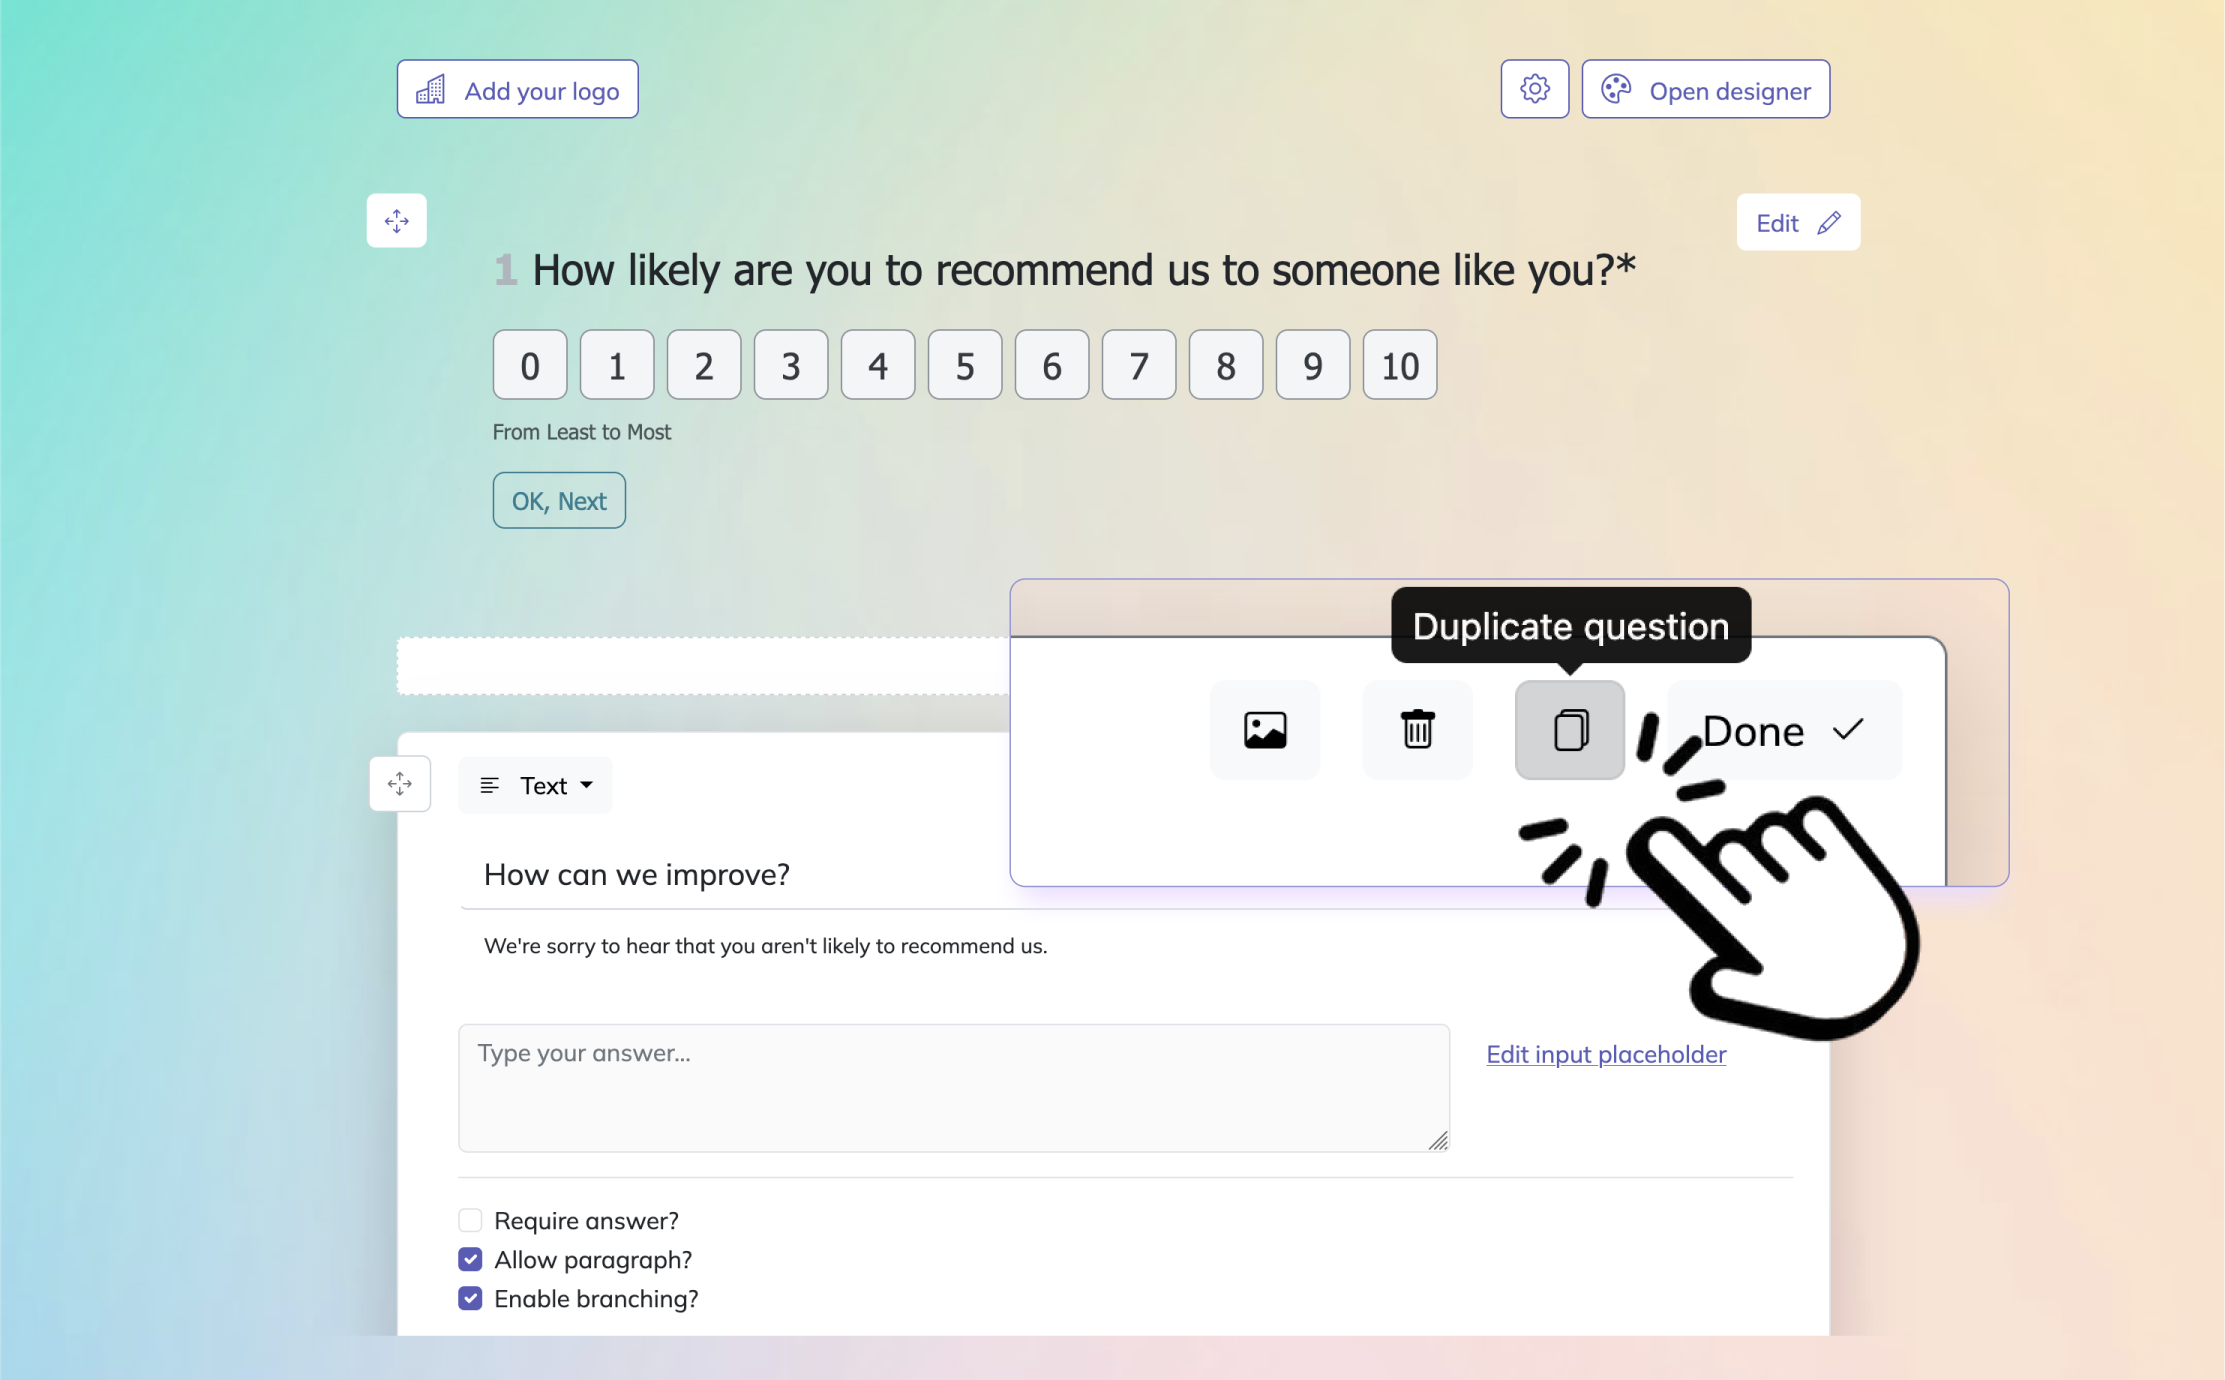
1. Create a new survey
Start by opening HeySurvey and choosing a template, or create a survey from scratch. If you’re using a template, click the button below this guide to begin quickly. You can also start without an account, but you’ll need one to publish and view responses later. Once the survey editor opens, give your survey a clear name so it’s easy to find and manage.
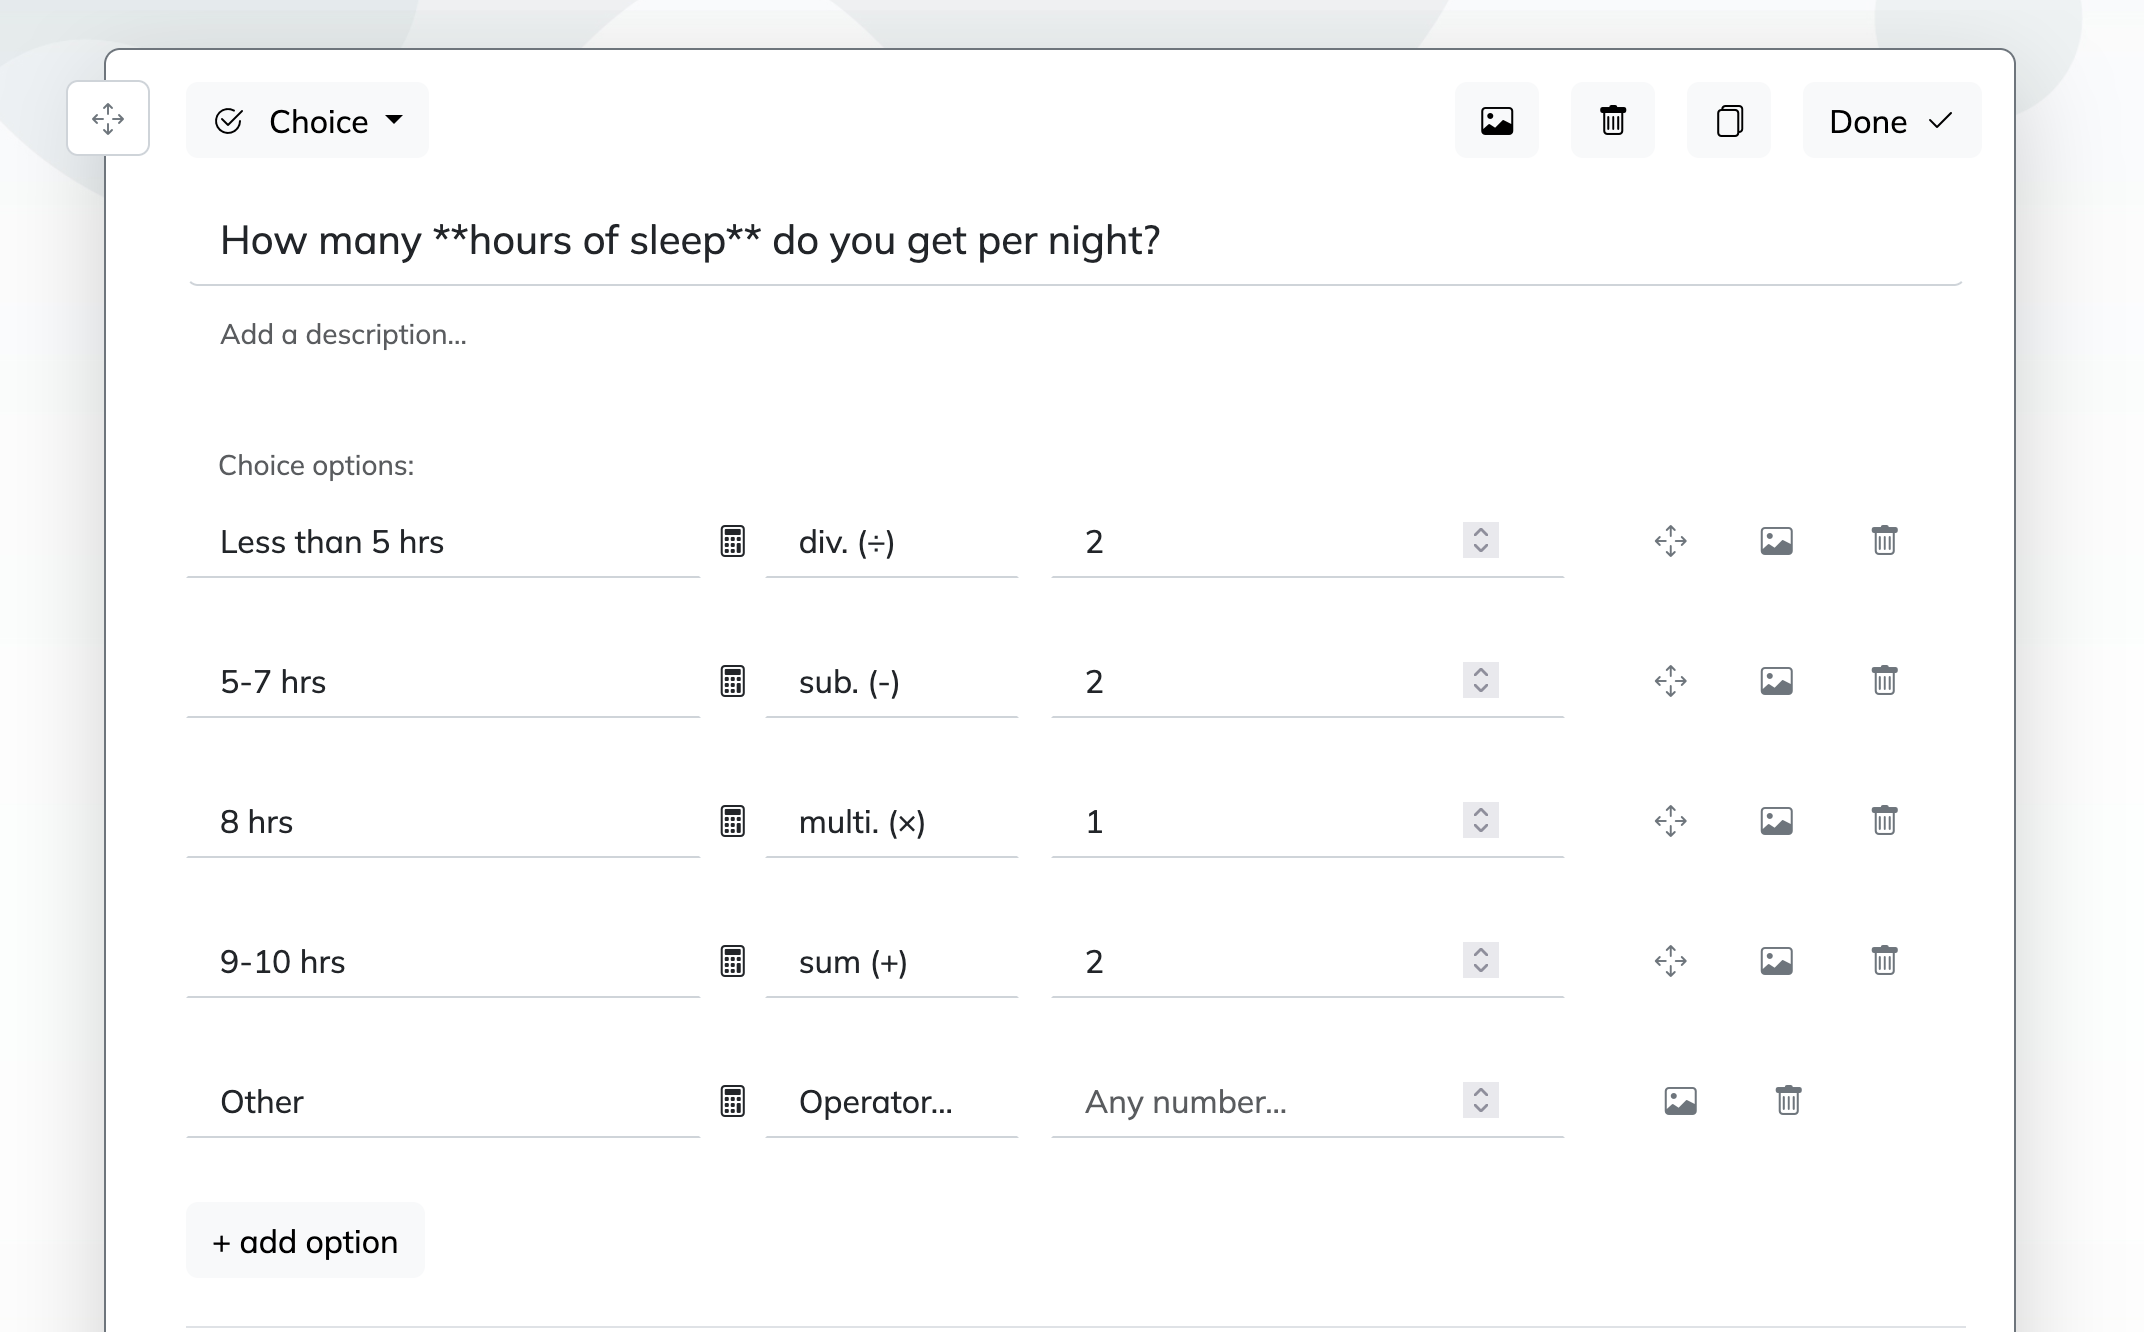
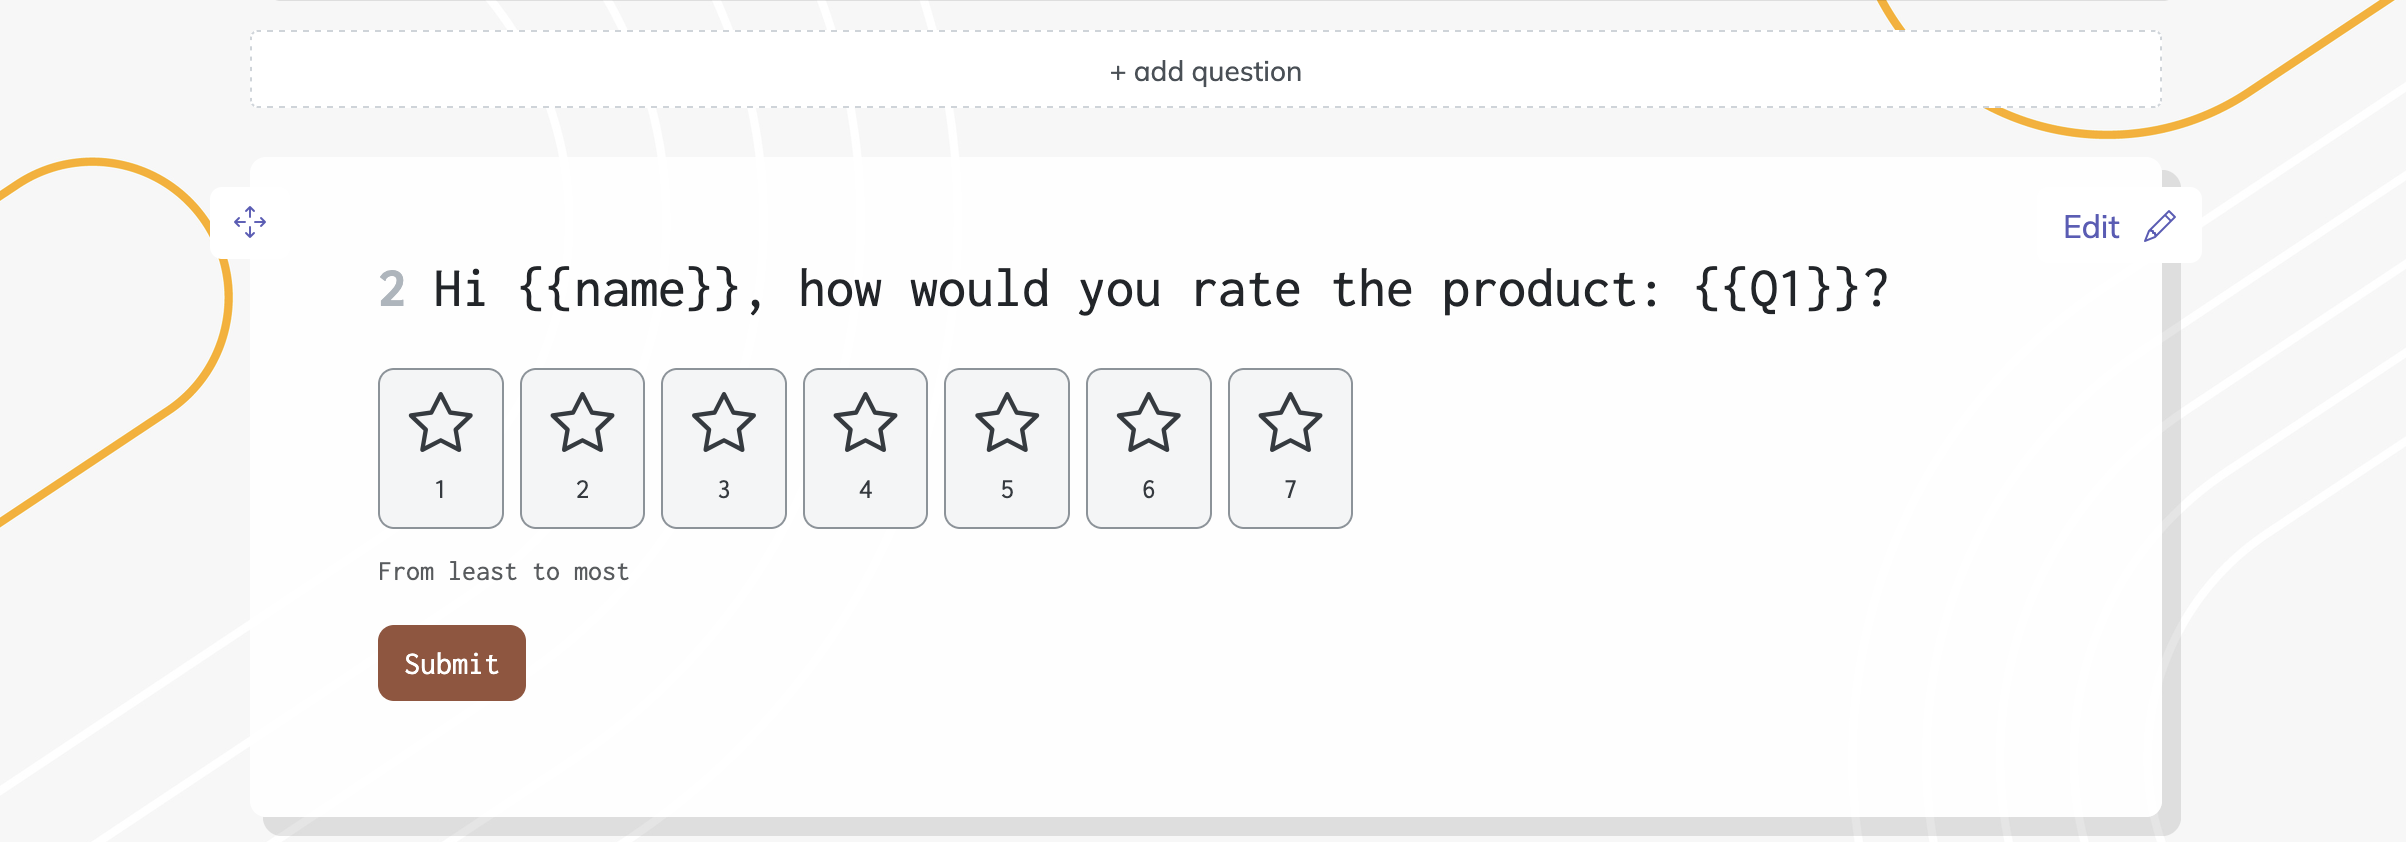
2. Add questions
Click Add Question and choose Scale for ratio scale survey questions. Enter your question text, then set the scale range, such as 1 to 5 or 0 to 10, depending on your survey. Add helpful labels for the low and high ends, like “Not important” and “Very important.” Repeat this step for each ratio scale question you want to include.
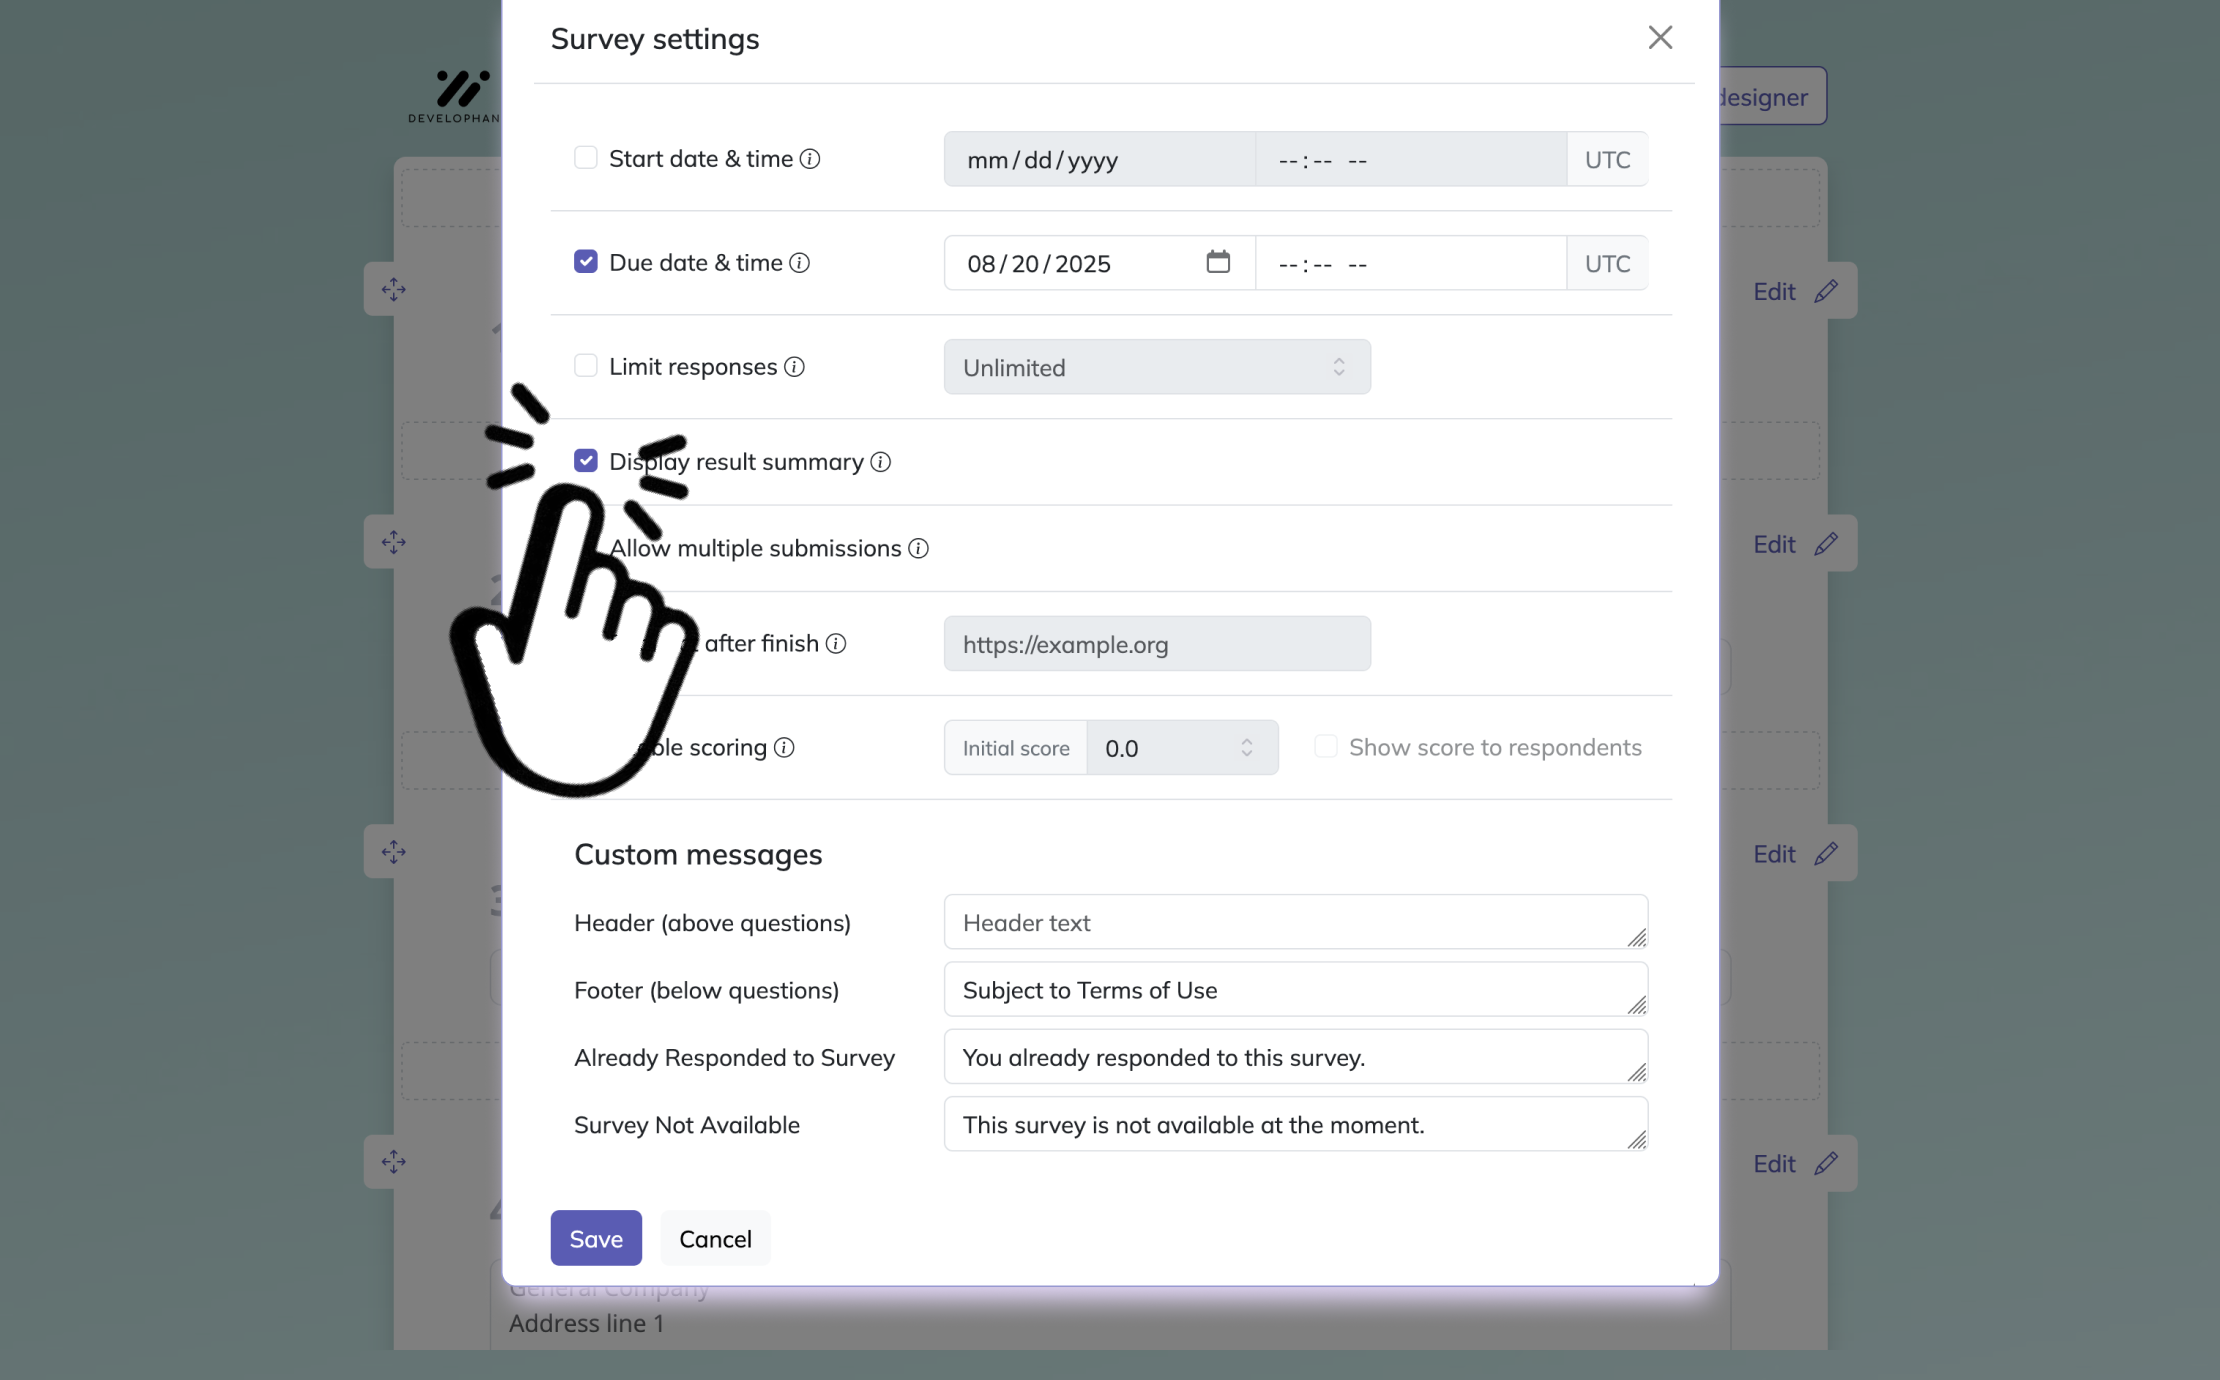
3. Publish survey
When your questions are ready, preview the survey to check how it looks and works. Then click Publish to make it live and get a shareable link. After publishing, you can send the survey to respondents and start collecting answers.
Customer Experience Ratio Scale Questions
Sample questions
How many minutes did you wait before speaking with a support representative?
How many times have you contacted our support team in the past 30 days?
How much did you spend on your most recent purchase with us?
How many days did it take for your order to arrive?
How many product issues did you experience before your problem was resolved?
Track the journey, not just the mood
Why & When to Use
Customer experience ratio scale questions help you measure the parts of the journey customers can actually count, like wait time, delivery days, number of issues, or purchase amount.
Here’s the thing: if you want data your team can compare across customer groups or month to month, this format is a strong choice.
These questions work best when you ask for real numbers instead of opinions.
Ask “How many days did delivery take?”
Not “Was delivery fast?”
That one small switch gives you cleaner data for spotting patterns, fixing friction, and making smarter decisions without squinting at vague feedback like it is a horoscope.
Plus, different teams can use the same answers in different ways.
Customer support can track repeat contacts and resolution issues.
Operations can monitor delays, processing time, and fulfillment speed.
Retention teams can connect service problems to churn risk or lower repeat purchases.
On top of that, these questions fit naturally into surveys sent right after key moments.
after a purchase
after a support interaction
after a delivery or completed service
If you need hard numbers about what customers experienced, not just how they felt about it, ratio scale questions do the job neatly and reliably.
Ratio-scale survey questions capture countable experiences like wait time, spending, and delivery days because they use a true zero and support meaningful comparisons (Scribbr).
Product Usage Ratio Scale Questions
Sample questions
How many times did you log in to the platform last week?
How many hours did you spend using the product in the past 7 days?
How many projects did you complete using this tool last month?
How many team members actively used the feature during the past 30 days?
How much storage space does your team currently use in our platform?
Measure what people actually do
Why & When to Use
Product usage ratio scale questions help you track measurable engagement with a product, feature, tool, or service using real numbers, not fuzzy guesses.
Here’s the thing: if your product team needs hard usage data to check adoption, prove feature value, or spot drop-off early, this format is a very smart pick.
These questions are especially useful across SaaS products, mobile apps, subscriptions, and other digital platforms where usage patterns matter a lot.
SaaS teams can measure logins, projects completed, or seats actively used.
App teams can track session frequency, time spent, or feature use over a set period.
Subscription businesses can monitor how deeply customers use what they pay for.
Plus, ratio questions become extra handy when behavioral analytics are incomplete, blocked, or only tell part of the story.
Maybe tracking misses offline activity, shared usage, or admin-level behavior, which means your dashboard is not the whole movie.
On top of that, clear timeframes make these questions much more useful.
Use specific windows like daily, weekly, monthly, or past 30 days.
Avoid vague wording like “regularly” or “often.”
Match the timeframe to how your product is actually used.
If you want clean, comparable data about usage habits, ratio scale questions help you get there without asking users to read your mind.
Market Research Ratio Scale Questions
Sample questions
How many times have you purchased this type of product in the past 6 months?
How much do you typically spend on this product category each month?
How many brands did you consider before making your last purchase?
How many people in your household use this type of product?
How far did you travel to buy this product the last time you purchased it?
Turn opinions into purchase math
Why & When to Use
Market research ratio scale questions help you measure real quantities tied to buying behavior, product usage, and budget decisions.
Here’s the thing: when you want statistically useful data for segmentation, forecasting, or estimating demand, these questions give you numbers you can actually work with.
They are especially useful when you need to understand market size, usage intensity, and spending patterns without relying on vague customer impressions.
You can estimate how often people buy within a category.
You can compare spending levels across customer groups.
You can spot how many buyers are light, medium, or heavy users.
You can measure practical factors like travel distance or household usage.
Plus, these questions work best when the wording is concrete and measurable.
Skip soft phrases like “regularly” or “sometimes” and use specific units such as times per month, dollars spent, number of brands considered, or miles traveled.
On top of that, ratio scale questions pair especially well with demographic and behavioral segmentation, which is where things get extra useful, and a little nerdy in a fun way.
Compare responses by age, income, region, or household size.
Layer in behaviors like purchase frequency, loyalty, or channel preference.
Use the results to build sharper customer segments and stronger forecasts.
If you want market data that does more than sound nice in a slide deck, ratio questions are a smart move.
Ratio-scale survey questions capture quantities with equal intervals and a true zero, enabling meaningful comparisons like purchase frequency, spending, and household usage (Scribbr).
Employee Feedback Ratio Scale Questions
Sample questions
How many hours of overtime did you work in the past month?
How many training sessions did you attend in the last 90 days?
How many direct reports do you currently manage?
How many minutes is your typical one-way commute?
How many tasks or tickets do you complete in an average workday?
Measure work reality, not just morale
Why & When to Use
Employee feedback ratio scale questions help you collect hard numbers about workload, time, output, and day-to-day work patterns.
Here’s the thing: engagement surveys tell you how people feel, but ratio questions show what their work life actually looks like in measurable terms.
That makes them especially useful for HR, operations, and leadership teams that need concrete workforce insights instead of guesses dressed up in office clothes.
Use these questions when you want to measure practical areas like:
overtime hours
training time
commute length
team size
daily task volume
Plus, this kind of data can help you spot issues before they snowball into bigger problems.
You may uncover signs of burnout through heavy overtime, undertraining through low session counts, or workflow bottlenecks through unusually high or low output.
On top of that, ratio questions work best as a partner to opinion-based employee engagement questions, not a replacement.
If someone reports low morale and also logs extreme overtime, you get a much clearer picture.
Be thoughtful with sensitive topics like workload, overtime, or compensation-related amounts.
Keep wording neutral, explain why you are asking, and avoid making employees feel like every answer is headed straight to the boss's dramatic spreadsheet.
Healthcare and Patient Survey Ratio Scale Questions
Sample questions
How many days did you wait between scheduling your appointment and being seen?
How many times have you visited a healthcare provider in the past 12 months?
How many doses of your medication did you miss in the past 30 days?
How many minutes did you spend in the waiting room during your last visit?
How much did you pay out of pocket for your most recent appointment?
Turn care experiences into usable numbers
Why & When to Use
Healthcare and patient survey ratio scale questions help you measure real-world details like counts, wait times, missed doses, and out-of-pocket costs.
Here’s the thing: satisfaction scores tell you how care felt, but ratio questions show what actually happened.
That makes them especially useful when you need operational and outcome-related data, not just general opinions.
Use these questions when you want to track practical areas like:
appointment wait times
provider visit frequency
medication adherence
waiting room delays
patient expenses
Plus, this kind of data can support better decisions around patient access, treatment follow-through, and service improvements.
If patients report long delays, frequent visits, or high costs, you can spot patterns that need attention before they become bigger headaches.
On top of that, healthcare topics need extra care in how you phrase questions.
Use sensitive wording, keep recall periods realistic, and avoid asking people to remember every detail since the dawn of time.
Keep the medical context easy to understand, especially for general audiences who may not know clinical terms.
Simple wording helps people answer more accurately, which means your data is far more useful than a chart full of confused guessing.
Education Survey Ratio Scale Questions
Sample questions
How many hours do you spend studying each week for this course?
How many classes have you missed this term?
How many assignments did you submit on time this semester?
How many tutoring sessions did you attend this month?
How many books or learning resources did you use for this class?
Measure learning habits with real numbers
Why & When to Use
Education survey ratio scale questions help you measure concrete learning behaviors like study time, attendance, assignment completion, and resource use.
Here’s the thing: if you want to understand how people are actually learning, not just how confident they feel, these questions give you numbers you can work with.
They are especially useful for:
schools tracking student engagement
course creators improving lesson design
training programs measuring participation and follow-through
teachers spotting support needs early
professional learning teams evaluating course usage
Plus, this data can support performance analysis in a very practical way.
If a student studies many hours but still struggles, or attends class regularly but submits little on time, you can spot patterns that need a smarter support plan.
On top of that, these questions work best when you tie them to a clear timeframe.
Use periods like per week, per month, per term, or per course so people are not forced to make wild guesses like they are consulting an ancient scroll.
That clarity makes responses more accurate and easier to compare across students, classrooms, instructors, and workplace training groups.
You can use them with students, teachers, and professional learners anytime measurable behavior matters as much as outcomes.
Best Practices for Writing Ratio Scale Survey Questions
Sample questions
How many purchases have you made from our store in the past 90 days?
How many minutes did it take you to complete your onboarding?
How much did you spend on shipping for your last order?
How many times did you use this feature in the last month?
How many employees from your team attended the training?
Write for clean, usable numbers
Why & When to Use
This section helps you turn decent ratio questions into high-quality ones that produce accurate, analyzable data.
Here’s the thing: ratio questions are only useful if people can answer them clearly and without needing a detective board and red string.
Focus on clarity, precision, respondent effort, and how the data will actually be used.
If a question is vague or asks people to remember too much, your data gets shaky fast.
Good ratio questions usually follow a few simple rules:
define a clear unit like minutes, dollars, days, or number of times
include a specific timeframe
make sure zero is a valid and meaningful answer
keep wording simple, concrete, and easy to answer accurately
Plus, your format should match the business decision behind it.
If you need to improve onboarding speed, ask for minutes completed, not vague satisfaction mixed with time.
Avoid these common mistakes too:
asking for estimates across very long recall periods
mixing opinions with measurable quantities in one question
using fuzzy words like often, many, or regularly
forcing exact answers people are unlikely to know
choosing a ratio question when ordinal or nominal works better
On top of that, place this section after examples so readers can sharpen what they just learned and write smarter questions right away.
Common Mistakes to Avoid With Ratio Scale Questions
Sample questions
What are the biggest mistakes people make when writing ratio scale survey questions?
How can you tell if a ratio question is asking for information people cannot remember accurately?
When should you avoid using a ratio scale question and choose another question type instead?
How do unclear units affect the quality of survey responses?
What should you test before launching ratio scale questions in a live survey?
Don’t let bad math sneak into good surveys
Why & When to Use
This section helps you spot the errors that quietly wreck ratio question data before your survey goes live.
Here’s the thing: a question can look perfectly reasonable and still produce messy answers that are about as useful as a screen door on a submarine.
Watch for these common pitfalls:
asking for numbers people cannot realistically remember, like exact spending over the past year
using unclear units, such as asking how much time without saying minutes, hours, or days
using a ratio question when no true zero exists
writing questions that push people toward flattering answers
forgetting how the data will be grouped, compared, or reported later
Bad framing often sounds simple, but it creates fuzzy data.
Bad: How often do you spend a lot on office supplies?
Better: How many dollars did your team spend on office supplies last month?
Bad: How productive are you in hours?
Better: How many hours did you work on client projects yesterday?
Plus, long, mentally heavy questions increase survey fatigue, and tired people guess.
On top of that, test your questions before full deployment to catch confusing wording, weak recall periods, and analysis problems early.
Turning Ratio Scale Survey Insights Into Action
Sample questions
How can you turn ratio scale survey responses into decisions your team can actually use?
What should you measure after collecting ratio scale data besides the average?
How do you compare ratio scale results across customer groups, teams, or regions?
Why should you pair ratio questions with satisfaction or NPS-style feedback?
When are ratio scale questions the best choice for survey research?
From raw numbers to real-world moves
Why & When to Use
This section helps you turn plain number-based responses into practical next steps instead of letting them sit in a spreadsheet looking busy.
Here’s the thing: ratio data gets powerful when you stop treating it like trivia and start using it to guide decisions.
After collection, break results into meaningful groups so patterns show up faster.
segment by customer type, job role, subscription plan, department, or region
track averages, medians, ranges, and outliers
compare current results against past surveys to spot movement over time
pair numeric answers with satisfaction or NPS-style feedback for added context
A raw count becomes useful when it leads to action.
In product teams, that might mean shortening onboarding if new users need too many days to get started.
In customer experience, it could mean reducing wait times if support cases take longer than expected.
On top of that, HR teams can adjust staffing, healthcare teams can improve response times, and education teams can reshape support if students spend too many hours struggling alone.
Plus, outliers matter because one weird number can signal a broken process, not just a quirky respondent.
The takeaway is simple: use ratio scale survey questions when you need measurable behaviors, quantities, and outcomes you can compare, track, and improve.
Related Surveys
31 Social Media Survey Questions
Explore 25 social media survey questions with sample examples to boost engagement insights, audie...
28 Quantitative Survey Questions
Explore 25 quantitative survey questions with sample questions, examples, and tips to create clea...
29 Family Survey Questions
Discover 25 family survey questions with sample questions, tips, and ideas to gather honest feedb...