28 Quantitative Survey Questions
Explore 25 quantitative survey questions with sample questions, examples, and tips to create clear, measurable surveys for research and analysis.
Quantitative survey questions are closed-ended questions that give you measurable, comparable data, so you can spot patterns instead of guessing. Clear numbers beat vague hunches.
In this guide, you’ll learn the main types of quantitative survey questions, when to use each one, sample question ideas, and how to turn responses into smart decisions.
Here’s the thing: these questions help you validate assumptions, track trends, segment audiences, and prioritize actions at scale, which is a fancy way of saying you get clearer answers from more people without needing a crystal ball, especially when you use an online survey tool to collect them.
What Are Quantitative Survey Questions?
Sample questions
How satisfied are you with your purchase on a scale of 1 to 10?
Did you find what you were looking for today?
Which feature do you use most often?
How likely are you to recommend us to a friend?
Rank these product benefits from most important to least important.
Quantitative survey questions give you countable answers.
They collect numerical or structured response data you can measure, compare, and analyze without squinting at a pile of vague opinions.
That means you get patterns you can actually work with, like average satisfaction scores, percentage breakdowns, and changes over time.
Qualitative questions are different.
They usually invite open-text answers, which help you understand why people feel a certain way, while quantitative questions help you see how often, how much, or how many.
Here are common quantitative response formats:
Rating scales
Yes/no questions
Multiple-choice questions
Rankings
Numeric input fields
Here’s the thing: the format matters more than it seems.
If your answer choices are confusing, inconsistent, or too broad, your data gets messy fast, and messy data is like trying to build IKEA furniture with half the screws missing.
Why & When to Use
Use quantitative questions when you want fast analysis, clean benchmarks, and clearer decision-making.
They’re especially useful when you need to:
Track trends over time
Compare groups or segments
Measure satisfaction or performance
Support decisions with evidence
Plus, strong surveys usually mix several question types instead of relying on just one, which gives you richer data without making the survey feel repetitive.
Closed-ended quantitative survey questions generally yield lower nonresponse than open-ended questions, improving completeness and comparability of survey data (source)
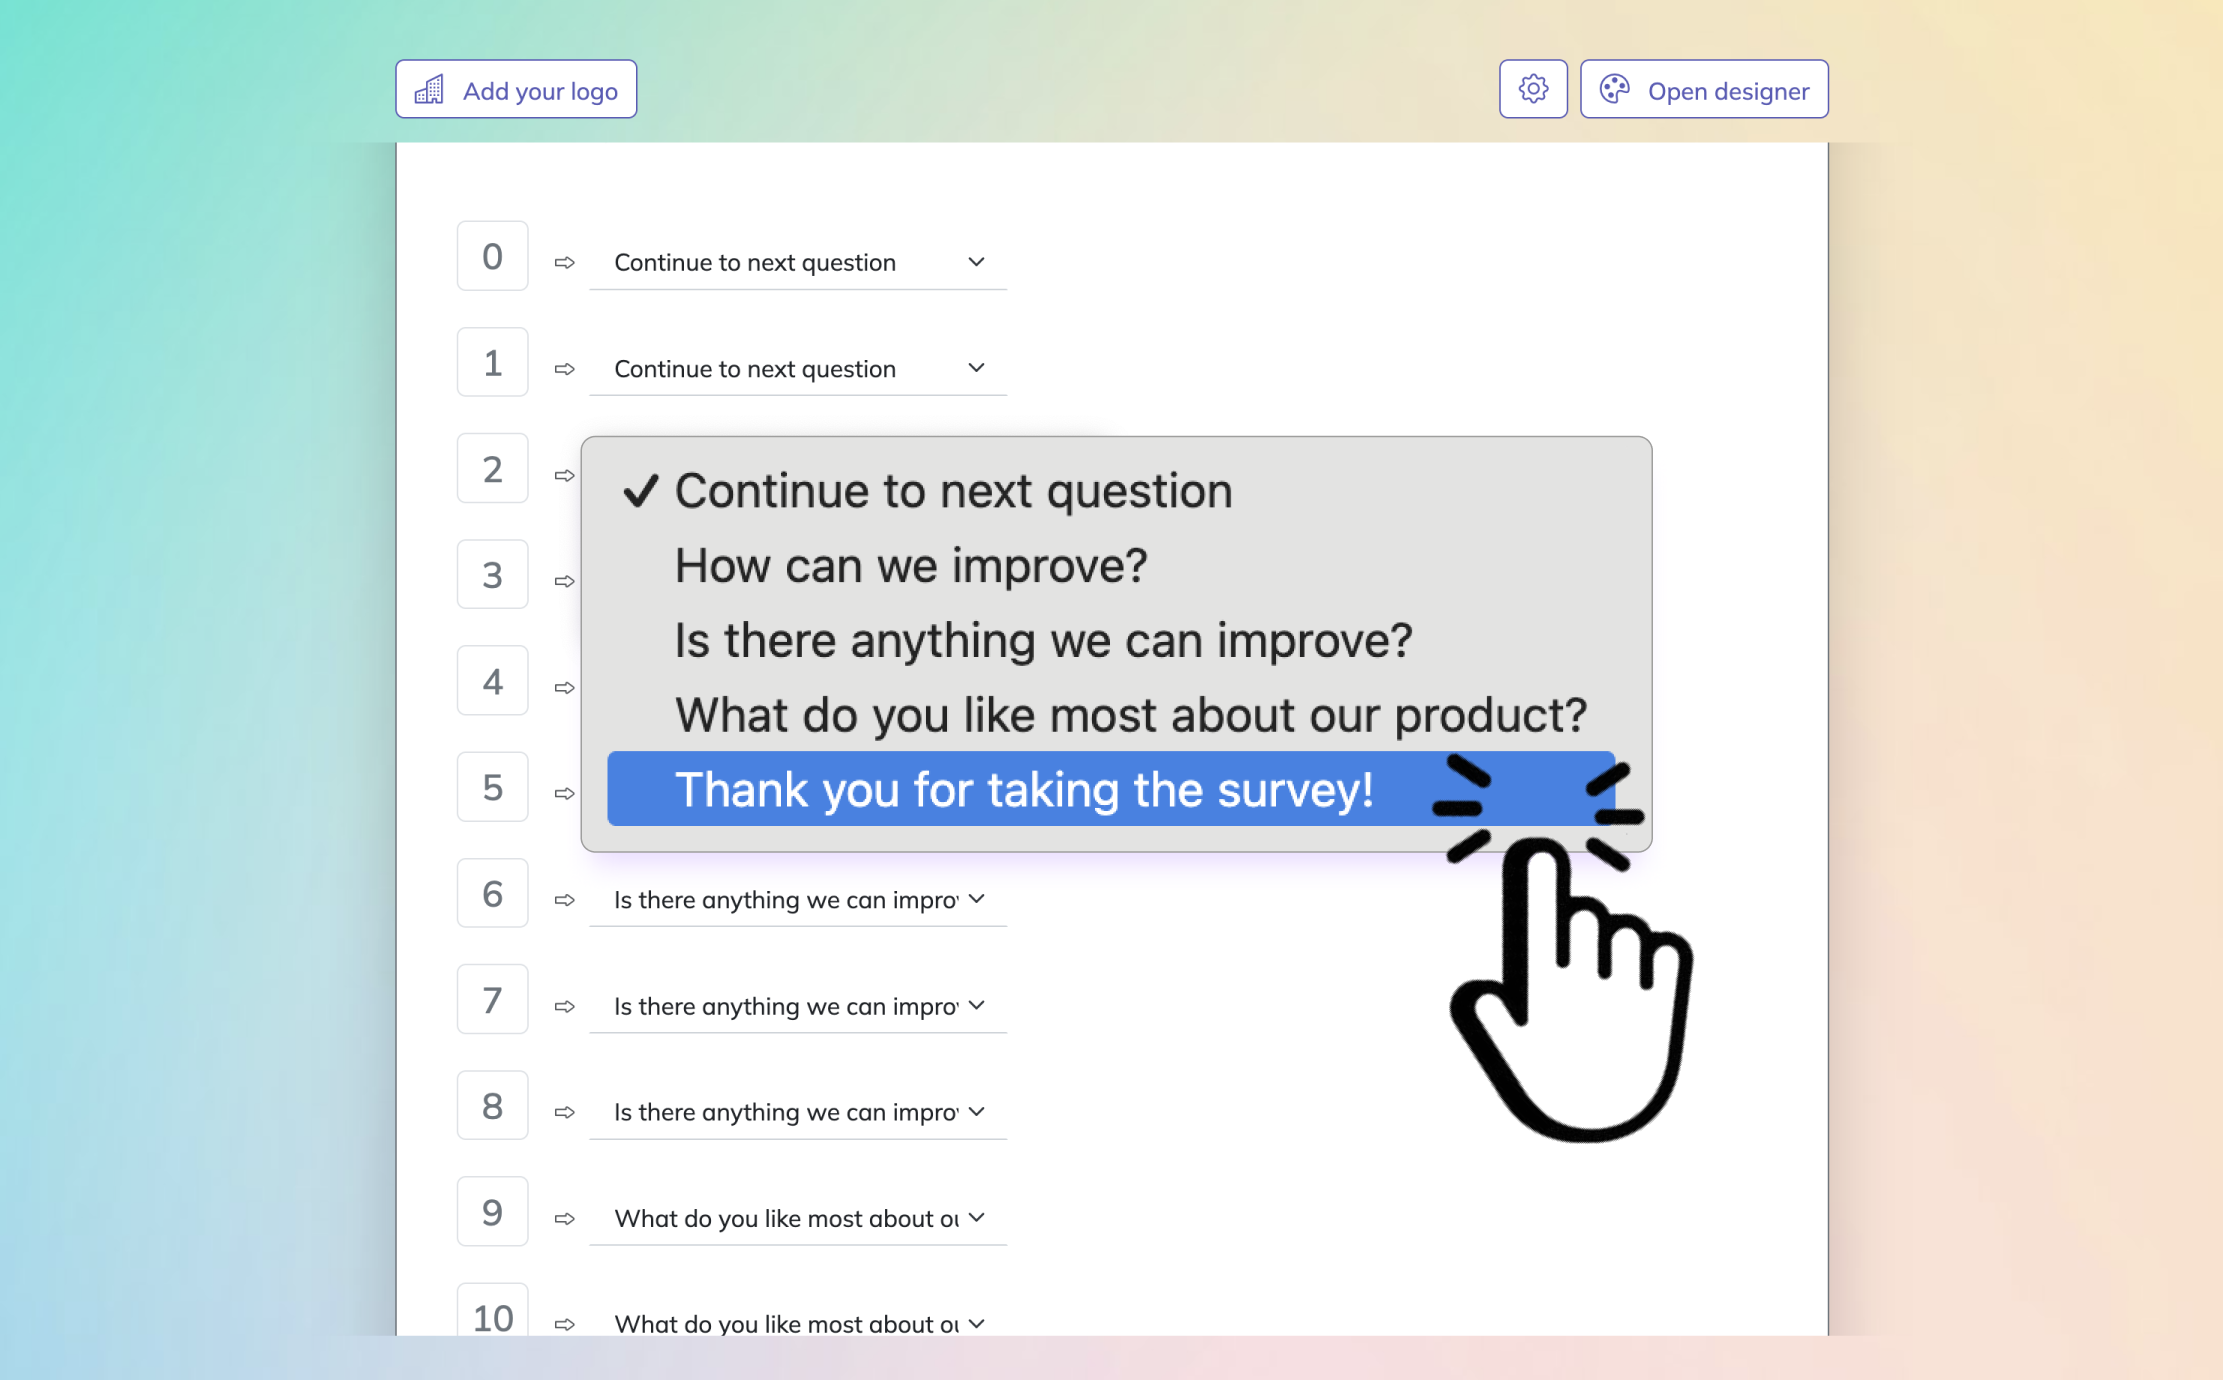
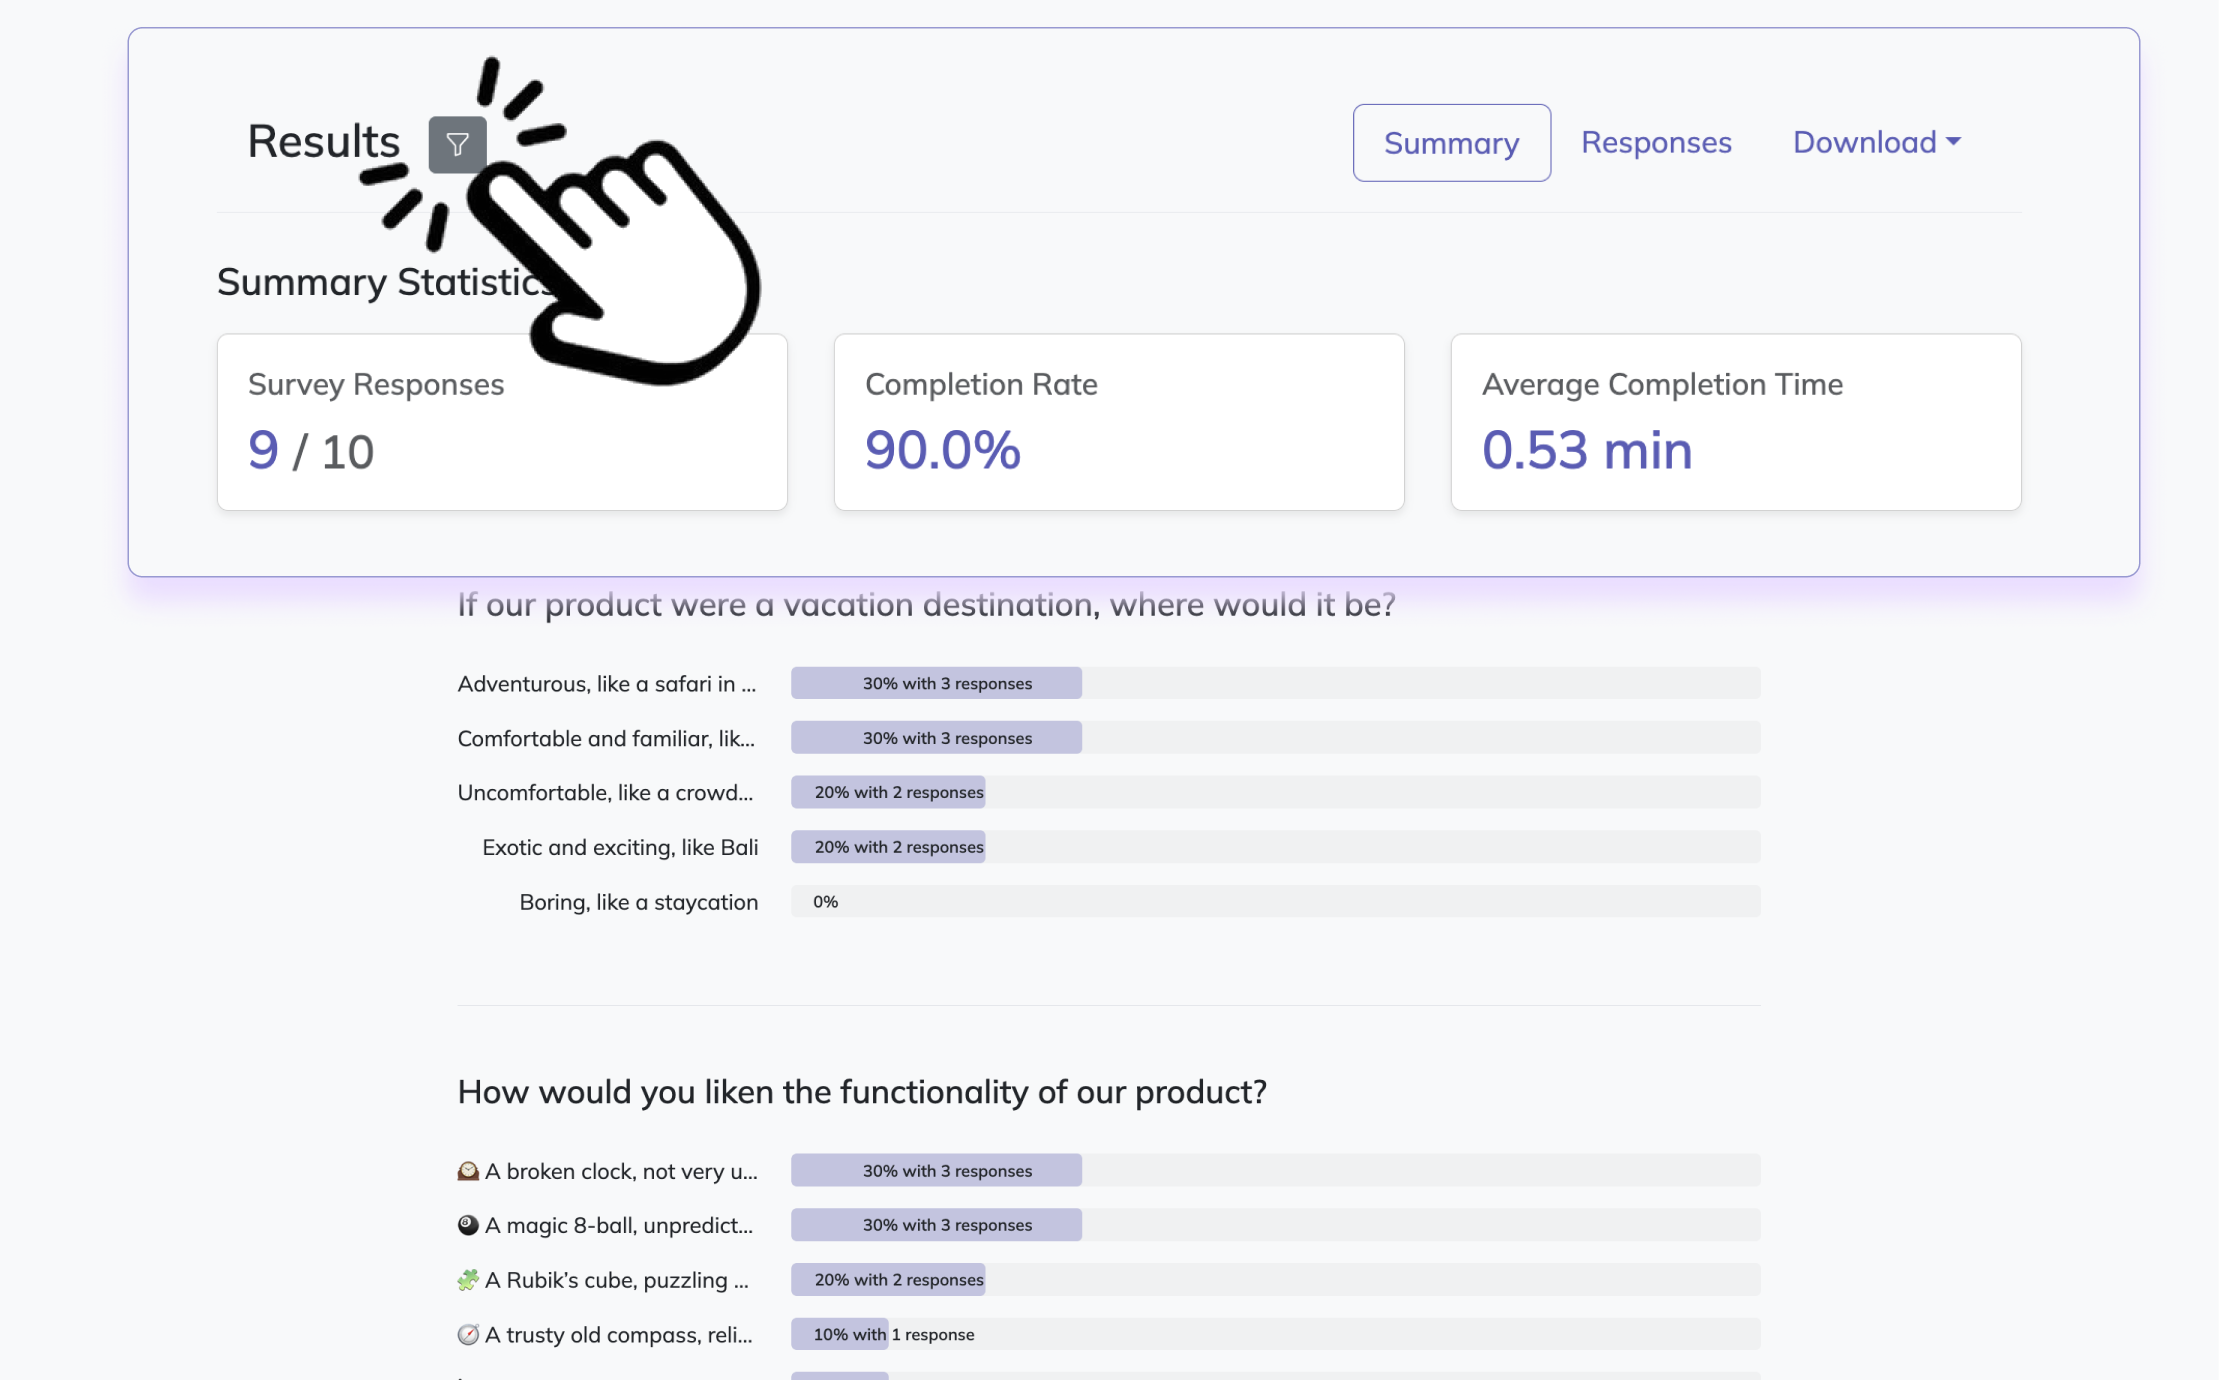
Here’s how to create a quantitative survey in HeySurvey:
Create a new survey
Open HeySurvey and start from a template using the button below, or choose an empty sheet if you want to build from scratch. Give your survey a clear name in the editor. If needed, adjust basic settings like layout, progress bar, or branding before adding questions.Add questions
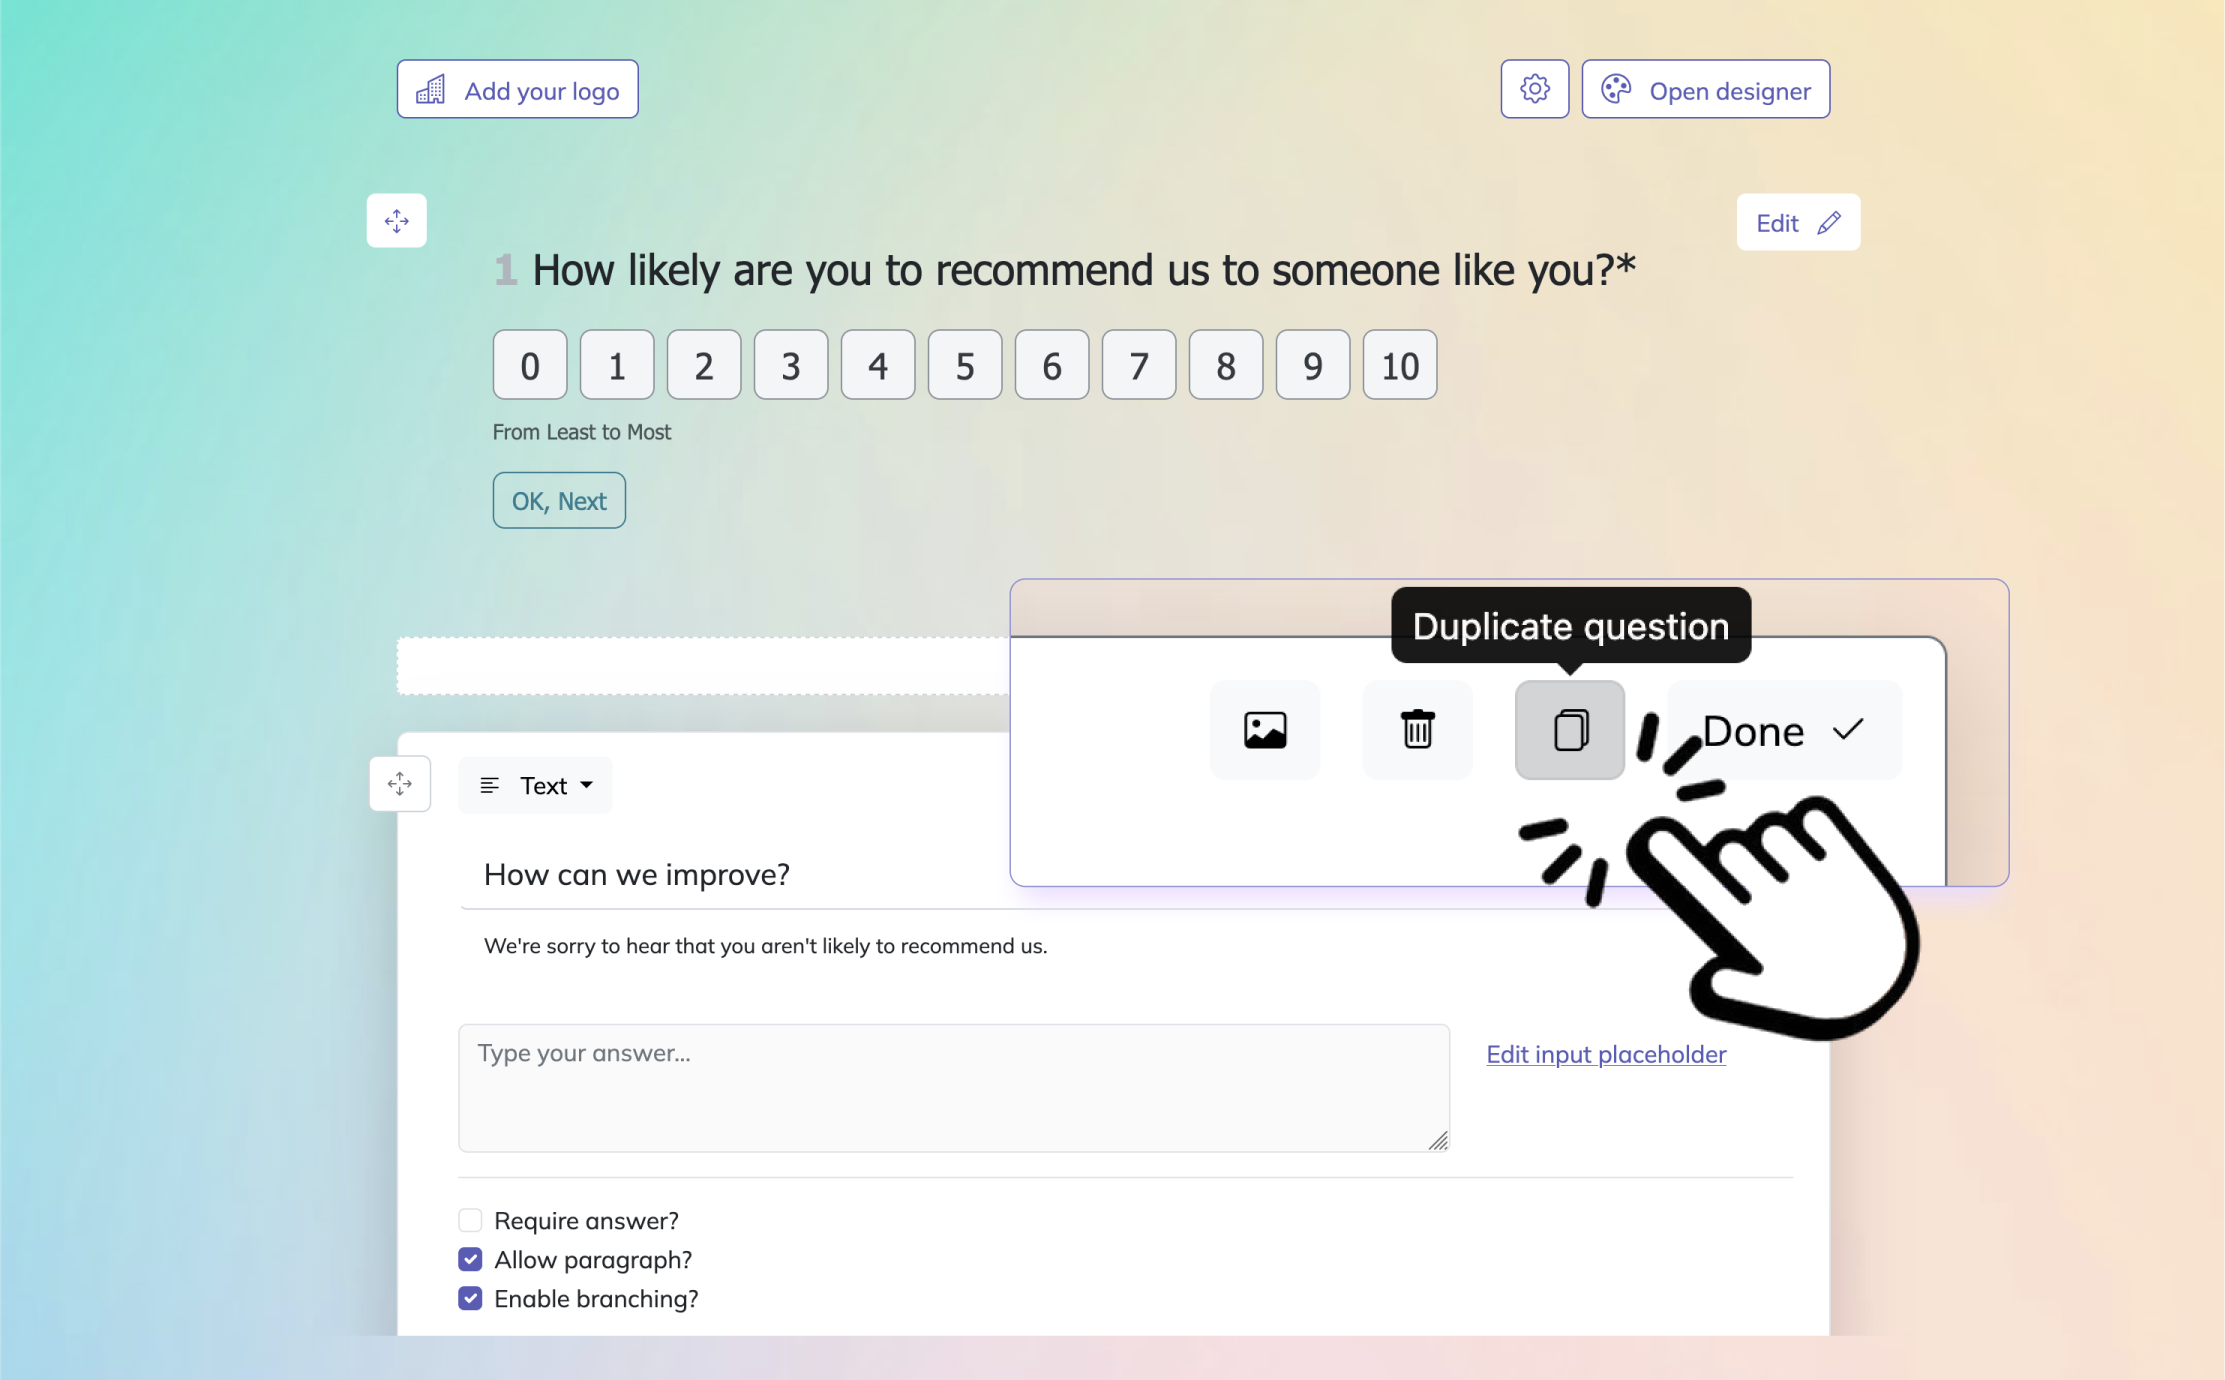
Click Add Question and choose question types that fit quantitative research, such as Number, Scale, NPS, Choice, or Matrix. Write short, clear questions and add answer options, rating ranges, or labels as needed. Mark important questions as required so respondents cannot skip them.Publish your survey
Preview the survey first to check how it looks on desktop and mobile. When everything is ready, click Publish to create a shareable link. Send that link to respondents, or embed the survey on your website if you prefer.
Likert Scale Questions
Sample questions
How satisfied are you with our product overall?
How strongly do you agree with the statement: “This service provides good value for money”?
How easy was it to complete your purchase today?
How likely are you to trust this brand compared with others in the market?
How confident are you in using the main features of the platform without help?
Likert scale questions help you measure sentiment with structure.
They show how people feel on a consistent scale, which makes attitudes, perceptions, agreement, satisfaction, and confidence much easier to compare.
Instead of getting a fuzzy “it’s fine, I guess,” you get data you can sort, chart, and actually use.
Here’s the thing: Likert questions work best when every response option feels clear and evenly spaced.
That is why balanced scales like 5-point or 7-point formats are usually your safest bet.
Use labels that make each point obvious, especially at the ends of the scale, so respondents are not left playing psychic with your survey.
You also want to stay consistent within the same section.
Use agreement scales for agreement questions
Use satisfaction scales for satisfaction questions
Use frequency scales for frequency questions
Avoid mixing them randomly unless you enjoy cleaning up confusing data later
Why & When to Use
Use Likert scale questions when you want to quantify sentiment across a standard response scale.
They are especially useful for customer satisfaction, employee engagement, product feedback, and brand perception.
Plus, when you keep the scale format consistent, you make results easier to analyze and easier for people to answer without stopping to decode the options.
Research commonly finds 5- and 7-point Likert scales provide practical, reliable measurement of attitudes while preserving usable distinctions between response options (source)
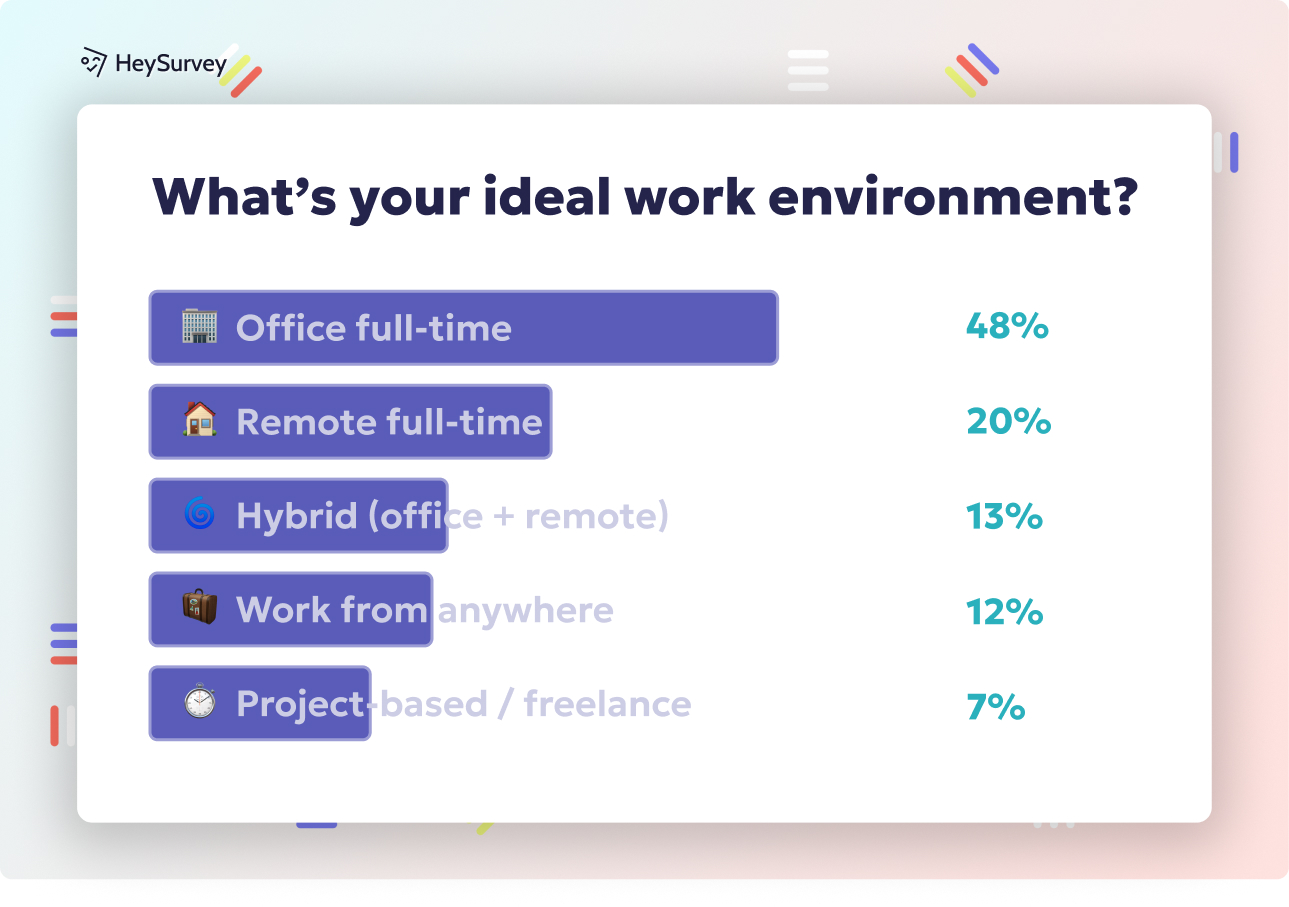
Multiple-Choice Questions
Sample questions
Which of the following best describes your primary reason for using this product?
How did you first hear about our company?
Which subscription plan are you currently using?
How often do you purchase from our brand?
What is your preferred method for receiving customer support?
Multiple-choice questions turn messy opinions into tidy, usable buckets.
They help you sort people into defined groups fast, which makes your survey results much easier to count, compare, and analyze.
Here’s the thing: these questions work best when you already know the most likely answer options and want people to choose one, or a small set, from that list.
They are especially handy for demographics, product usage, purchase behavior, channel preferences, and awareness levels.
If only one answer should be true, make the options mutually exclusive so respondents are not stuck choosing between two technically correct answers. That is how good data stays good.
Plus, if more than one answer could honestly apply, use “select all that apply” on purpose, not by default. It is useful, but it changes analysis because each option becomes its own mini yes-or-no result.
Use “Other” only when there is a real chance your list misses something important.
Use single-select when answers should not overlap
Use multi-select when people may genuinely fit more than one option
Add “Other” only if you need flexibility without guessing every possible response
Keep answer choices clear, specific, and easy to scan
Why & When to Use
Use multiple-choice questions when you want structured responses that are easy to group and analyze.
They are a smart pick when respondents should choose one answer, or a limited set of answers, from predetermined options.
On top of that, they make surveys feel quicker to complete, which keeps people moving instead of staring at the screen like it just asked them to solve a riddle.
Rating Scale Questions
Sample questions
On a scale of 1 to 10, how would you rate your overall experience with our support team?
How would you rate the quality of our product packaging?
On a scale of 1 to 5, how useful is this feature to your daily work?
How would you rate the speed of our checkout process?
On a scale of 1 to 10, how likely are you to recommend our service to a colleague?
Rating scale questions help you measure how strongly people feel, fast.
They ask respondents to score an experience, feature, or attribute using numbers, which gives you quick feedback that is easy to compare across responses.
Here’s the thing: rating scales are great when you want to measure performance, quality, or intensity without making people write a mini essay before lunch.
They work especially well for event feedback, support interactions, product feature ratings, and service evaluations.
A rating scale is not quite the same as a Likert scale.
Rating scales measure a score on a numeric range, while Likert scales usually measure agreement with a statement, such as from strongly disagree to strongly agree.
Plus, consistency matters more than people think.
Keep the scale direction the same throughout the survey, such as low to high
Choose 1-to-5 for quick feedback and simpler decisions
Use 1-to-10 when you want more detail and finer differences
Label scale endpoints clearly so nobody has to guess what a 1 or 10 means
Why & When to Use
Use rating scale questions when you need fast, structured feedback on how good, useful, easy, or satisfying something feels.
They are a strong fit when you want measurable scores for experiences and interactions, and not just vague impressions.
On top of that, pick your scale intentionally and stick with it, because switching directions halfway through is a great way to make your data do cartwheels.
Fully labeling rating-scale response options can reduce measurement error versus endpoint-only labels in survey questions (Menold et al., 2014).
Ranking Questions
Sample questions
Rank the following product features from most important to least important.
Rank these factors based on what most influences your purchase decision.
Rank the following support channels in order of preference.
Rank these content formats based on how likely you are to engage with them.
Rank the following improvements based on which should be prioritized first.
Ranking questions help you see what people value most when they have to choose.
Instead of letting respondents say everything matters, ranking questions ask them to put options in order, from highest priority to lowest.
Here’s the thing: that makes them especially useful when you want to understand trade-offs, not just what gets the most polite applause.
You can use them to uncover what really drives decisions across things like product features, buying factors, content preferences, and benefit comparisons.
Plus, ranking tells you relative priority, not absolute happiness.
Someone might rank a feature first, but that does not mean they are thrilled with it, only that it matters more than the other choices on the list.
Keep the list short so people can answer without feeling like they are sorting socks in the dark.
Limit ranking lists to about 5 to 7 items
Use clear, distinct options so choices do not blur together
Avoid ranking long lists, because too many items make responses harder and less reliable
Remember that rankings show order of importance, not satisfaction level
Why & When to Use
Use ranking questions when you need respondents to reveal priorities by making real comparisons.
They work best when your goal is to understand what should come first, what matters most, and what people would choose if they could not pick everything.
On top of that, they are a smart fit for feature prioritization, purchase drivers, support channel preferences, and content planning.
Dichotomous Questions
Sample questions
Have you purchased from us in the last 6 months?
Are you the primary decision-maker for this type of purchase?
Were you able to find the information you needed on our website?
Do you currently use a competing product?
Would you be interested in participating in future research?
Dichotomous questions keep things fast and crystal clear.
These questions offer just two response options, usually yes/no, true/false, or agree/disagree.
Here’s the thing: that simplicity is exactly why they work so well when you need a quick answer without making people stop and overthink.
They are especially useful for qualifying respondents, confirming facts, or routing simple decisions in a survey.
Plus, they shine early in a survey when you want to segment people into the right group before asking more detailed questions.
Common use cases include:
screening questions
awareness checks
eligibility validation
behavior confirmation
On top of that, they are easy to answer and easy to analyze, which is a lovely combo for both you and your spreadsheet.
Why & When to Use
Use dichotomous questions when your goal is speed, clarity, and clean decision-making.
They work best when you need to verify something specific, such as whether someone qualifies, recognizes a brand, completed an action, or fits a target audience.
They are a smart choice near the beginning of a survey because they help you quickly sort respondents and guide them down the right path.
Just do not use yes/no questions for complicated opinions, feelings, or motivations.
If the real answer is "sort of, but it depends," a binary question can flatten useful insight faster than a pancake.

Semantic Differential Questions
Sample questions
How would you rate our brand on a scale from Untrustworthy to Trustworthy?
How does this product feel: Complicated to Simple?
How would you describe our pricing: Expensive to Affordable?
How does our website appear: Outdated to Modern?
How would you rate our customer service: Unhelpful to Helpful?
Semantic differential questions help you measure perception with more nuance than a plain rating scale.
These questions ask people to rate something between two opposite adjectives, such as modern to outdated or helpful to unhelpful.
Here’s the thing: they are great when you want to understand how your brand, product, or message feels in someone’s mind, which is where the good stuff usually hides.
They are especially useful when your goal is to measure brand image, emotional positioning, or overall perception instead of hard facts or behaviors.
Common use cases include:
brand studies
campaign evaluation
product perception
messaging research
Plus, they make patterns easy to compare when you use the same scale format across multiple word pairs, which your future self will absolutely appreciate.
Why & When to Use
Use semantic differential questions when you want to see how people perceive something, not just whether they liked it.
They work best when you need feedback on image, tone, trust, value, or usability across a set of clear opposite adjectives.
On top of that, you should choose word pairs that are truly opposite and easy to understand, or the results can get fuzzy fast.
Keep the scale consistent across questions so you can compare responses cleanly.
Just do not use these for factual behaviors like what someone bought or how often they visited, because adjective scales are many things, but mind readers are not.
Best Practices for Writing Quantitative Survey Questions
Sample questions
Is the question clear enough that every respondent will read it the same way?
Are the answer choices complete, non-overlapping, and easy to compare?
Does this question ask only one thing at a time?
Is the wording neutral, specific, and relevant to the survey goal?
Have you tested this question with a small sample before sending it to everyone?
Great survey questions feel simple to answer and powerful to analyze.
Here’s the thing: this section is your practical framework for getting better data, reducing bias, and avoiding questions that look fine until they quietly wreck your results.
Why & When to Use
Use these best practices whenever you write, review, or clean up a quantitative survey.
They matter most when you want higher completion rates, more accurate answers, and fewer "what on earth did they mean?" moments.
Dos
Use clear, specific wording like "In the past 30 days, how many times did you order from us?" instead of "How often do you use us?"
Keep answer choices consistent and logically ordered, such as lowest to highest.
Ask one thing at a time. Bad: "How satisfied are you with price and quality?" Better: split that into two questions.
Match the question type to the goal, like multiple choice for categories and rating scales for attitudes.
Use balanced scales with defined endpoints, such as 1 = Very dissatisfied and 5 = Very satisfied.
Pilot test before launch, because tiny confusion can become giant spreadsheet chaos.
Make answer choices collectively complete where possible, including options like "Other" or "Not applicable."
Don’ts
Do not use leading wording like "How excellent was your experience with our helpful team?"
Do not combine multiple ideas in one question.
Do not overload people with too many scale formats in one survey.
Do not use overlapping ranges like 18 to 25 and 25 to 34.
Do not force ranking if several items could matter equally.
Do not use vague terms like "regularly" or "often" without a time frame.
Do not ask for extra data that does not support your goal.
Plus, keep surveys tight. Longer surveys usually mean more drop-off, more rushed answers, and more random clicking near the end.
On top of that, put easy and relevant questions first, group similar topics together, and keep phrasing neutral so you measure opinions instead of planting them.
How to Turn Quantitative Survey Data Into Action
Sample questions
What patterns show up when you compare responses by customer type, behavior, or segment?
Which survey results point to the biggest friction points or strongest satisfaction drivers?
How do results differ across time periods, channels, or audience groups?
Which findings should turn into business actions, tests, or content updates first?
What decision will each survey question help you make before you launch it?
Good survey data earns its keep when you actually use it.
Here’s the thing: collecting numbers is only half the job. If nobody interprets them or acts on them, your survey becomes a very organized pile of shrugging.
Why & When to Use
Use this process right after survey collection, and ideally before launch too.
Plus, if you tie each question to a decision in advance, you make analysis faster, cleaner, and much more useful.
A practical post-survey process looks like this:
Group responses by segment, behavior, channel, or customer type.
Look for patterns, averages, and outliers that explain what is normal and what is waving a tiny red flag.
Compare results across time periods, audiences, or acquisition channels.
Identify the biggest friction points, strongest drivers of satisfaction, and highest-priority improvements.
Turn findings into specific actions, experiments, messaging updates, or product changes.
On top of that, prioritize what to do next based on impact and feasibility.
A fix that helps many people and is easy to implement usually deserves attention before the fancy project with a dramatic slide deck.
Share results with stakeholders in a short, insight-led summary.
Focus on what happened, why it matters, and what you recommend next, because better quantitative survey questions lead to better decisions, not just prettier charts.
Related Surveys
31 Social Media Survey Questions
Explore 25 social media survey questions with sample examples to boost engagement insights, audie...
29 Family Survey Questions
Discover 25 family survey questions with sample questions, tips, and ideas to gather honest feedb...

29 Ratio Scales Survey Questions Examples
Explore 25 keyword ratio scales survey questions examples with clear sample questions, practical ...