27 Quantitative Research Survey Questions Examples
Explore 25 quantitative research survey questions examples with sample questions for clear, data-driven surveys, analysis, and research insights.
If you want survey data you can actually measure, compare, and trust, quantitative research survey questions are your starting point. They are structured questions built to collect numerical data at scale, so your results are less guesswork and more "aha, there it is."
In this article, you’ll see the main survey question types, when to use each one, and practical examples marketers, researchers, students, and business teams can adapt. Plus, you’ll learn how to choose the right format to boost data quality, make analysis easier, and support smarter decisions without making your spreadsheet cry.
Sample questions
How satisfied are you with your overall customer experience on a scale of 1 to 10?
Which of the following features do you use most often?
Would you recommend this product to a friend or colleague?
What Are Quantitative Research Survey Questions?
Countable answers beat vague guesses.
Quantitative research survey questions are designed to give you responses you can measure, compare, and analyze.
Instead of collecting long opinions or open-ended stories, they focus on structured answers like numbers, categories, and fixed choices.
That is the big difference from qualitative questions, which explore thoughts, feelings, and explanations in more depth.
Here’s the thing: if you want trends, percentages, averages, or side-by-side comparisons, quantitative questions are usually your best friend.
You’ll see them used across all kinds of projects, including:
customer feedback surveys
employee engagement studies
market research projects
academic research
product validation and testing
Strong quantitative questions also reduce ambiguity, which means people are more likely to interpret them the same way.
That makes your data cleaner and your conclusions far less wobbly, which is always nice when real decisions are on the line.
Common answer formats include:
rating scales
yes/no questions
rankings
multiple-choice selections
Plus, each format should match your research goal and how you plan to analyze the results.
If you want to measure satisfaction, a scale works well.
If you want to identify preferences, rankings or multiple-choice options may fit better.
Why & When to Use
Use quantitative survey questions when you need measurable evidence, not just colorful commentary.
On top of that, they work best when your goal is to track patterns, compare groups, test assumptions, or make decisions backed by data instead of vibes alone.
Sample questions
How strongly do you agree that our product is easy to use?
How satisfied are you with the speed of our customer support response?
To what extent do you agree that this training improved your job performance?
How likely are you to recommend our service based on your recent experience?
How strongly do you agree that the pricing offers good value for money?
Closed-ended quantitative survey questions—such as multiple choice, rating scales, and yes/no items—produce structured, measurable data that can be easily compared and analyzed (Source).
How to create a quantitative research survey in HeySurvey
1. Create a new survey
Start by opening a template with the button below, or choose a blank survey if you want to build from scratch. HeySurvey lets you begin without an account, so you can explore first. Once your survey opens, give it a clear name and, if needed, add your logo or adjust basic settings like progress bar or response limits.
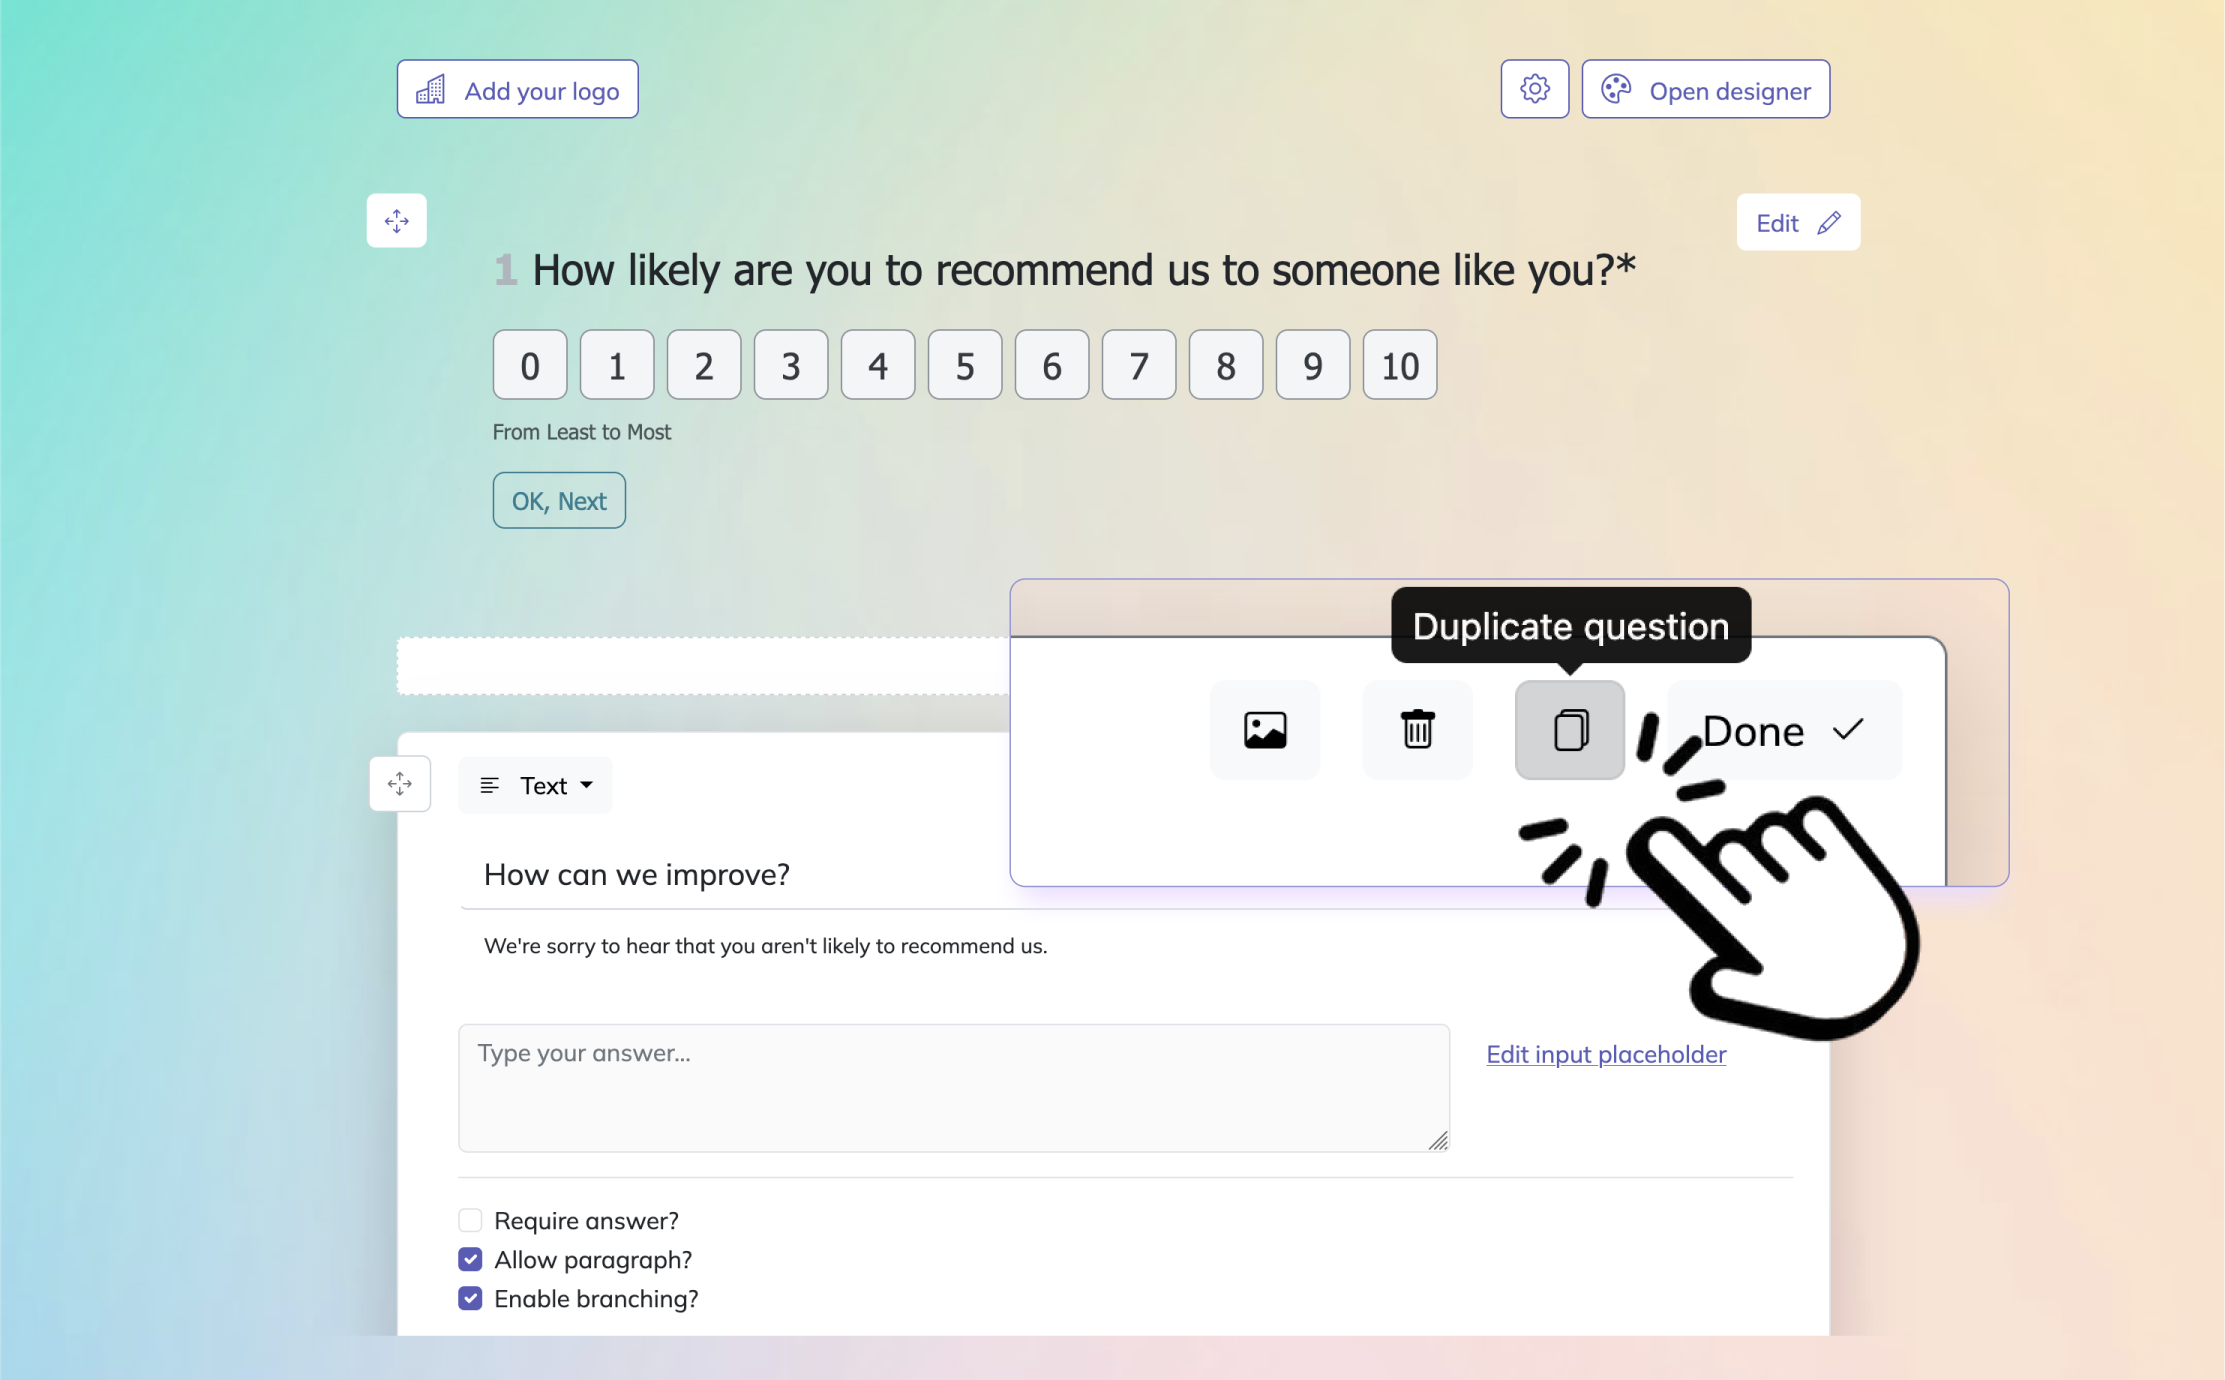
2. Add questions
Click Add Question and use quantitative-friendly formats such as Choice, Scale, NPS, Number, Dropdown, or Matrix. These question types help you collect structured answers that are easy to compare and analyze. Keep questions clear and use required fields when you want complete data. You can also add answer options, labels, and descriptions to guide respondents.
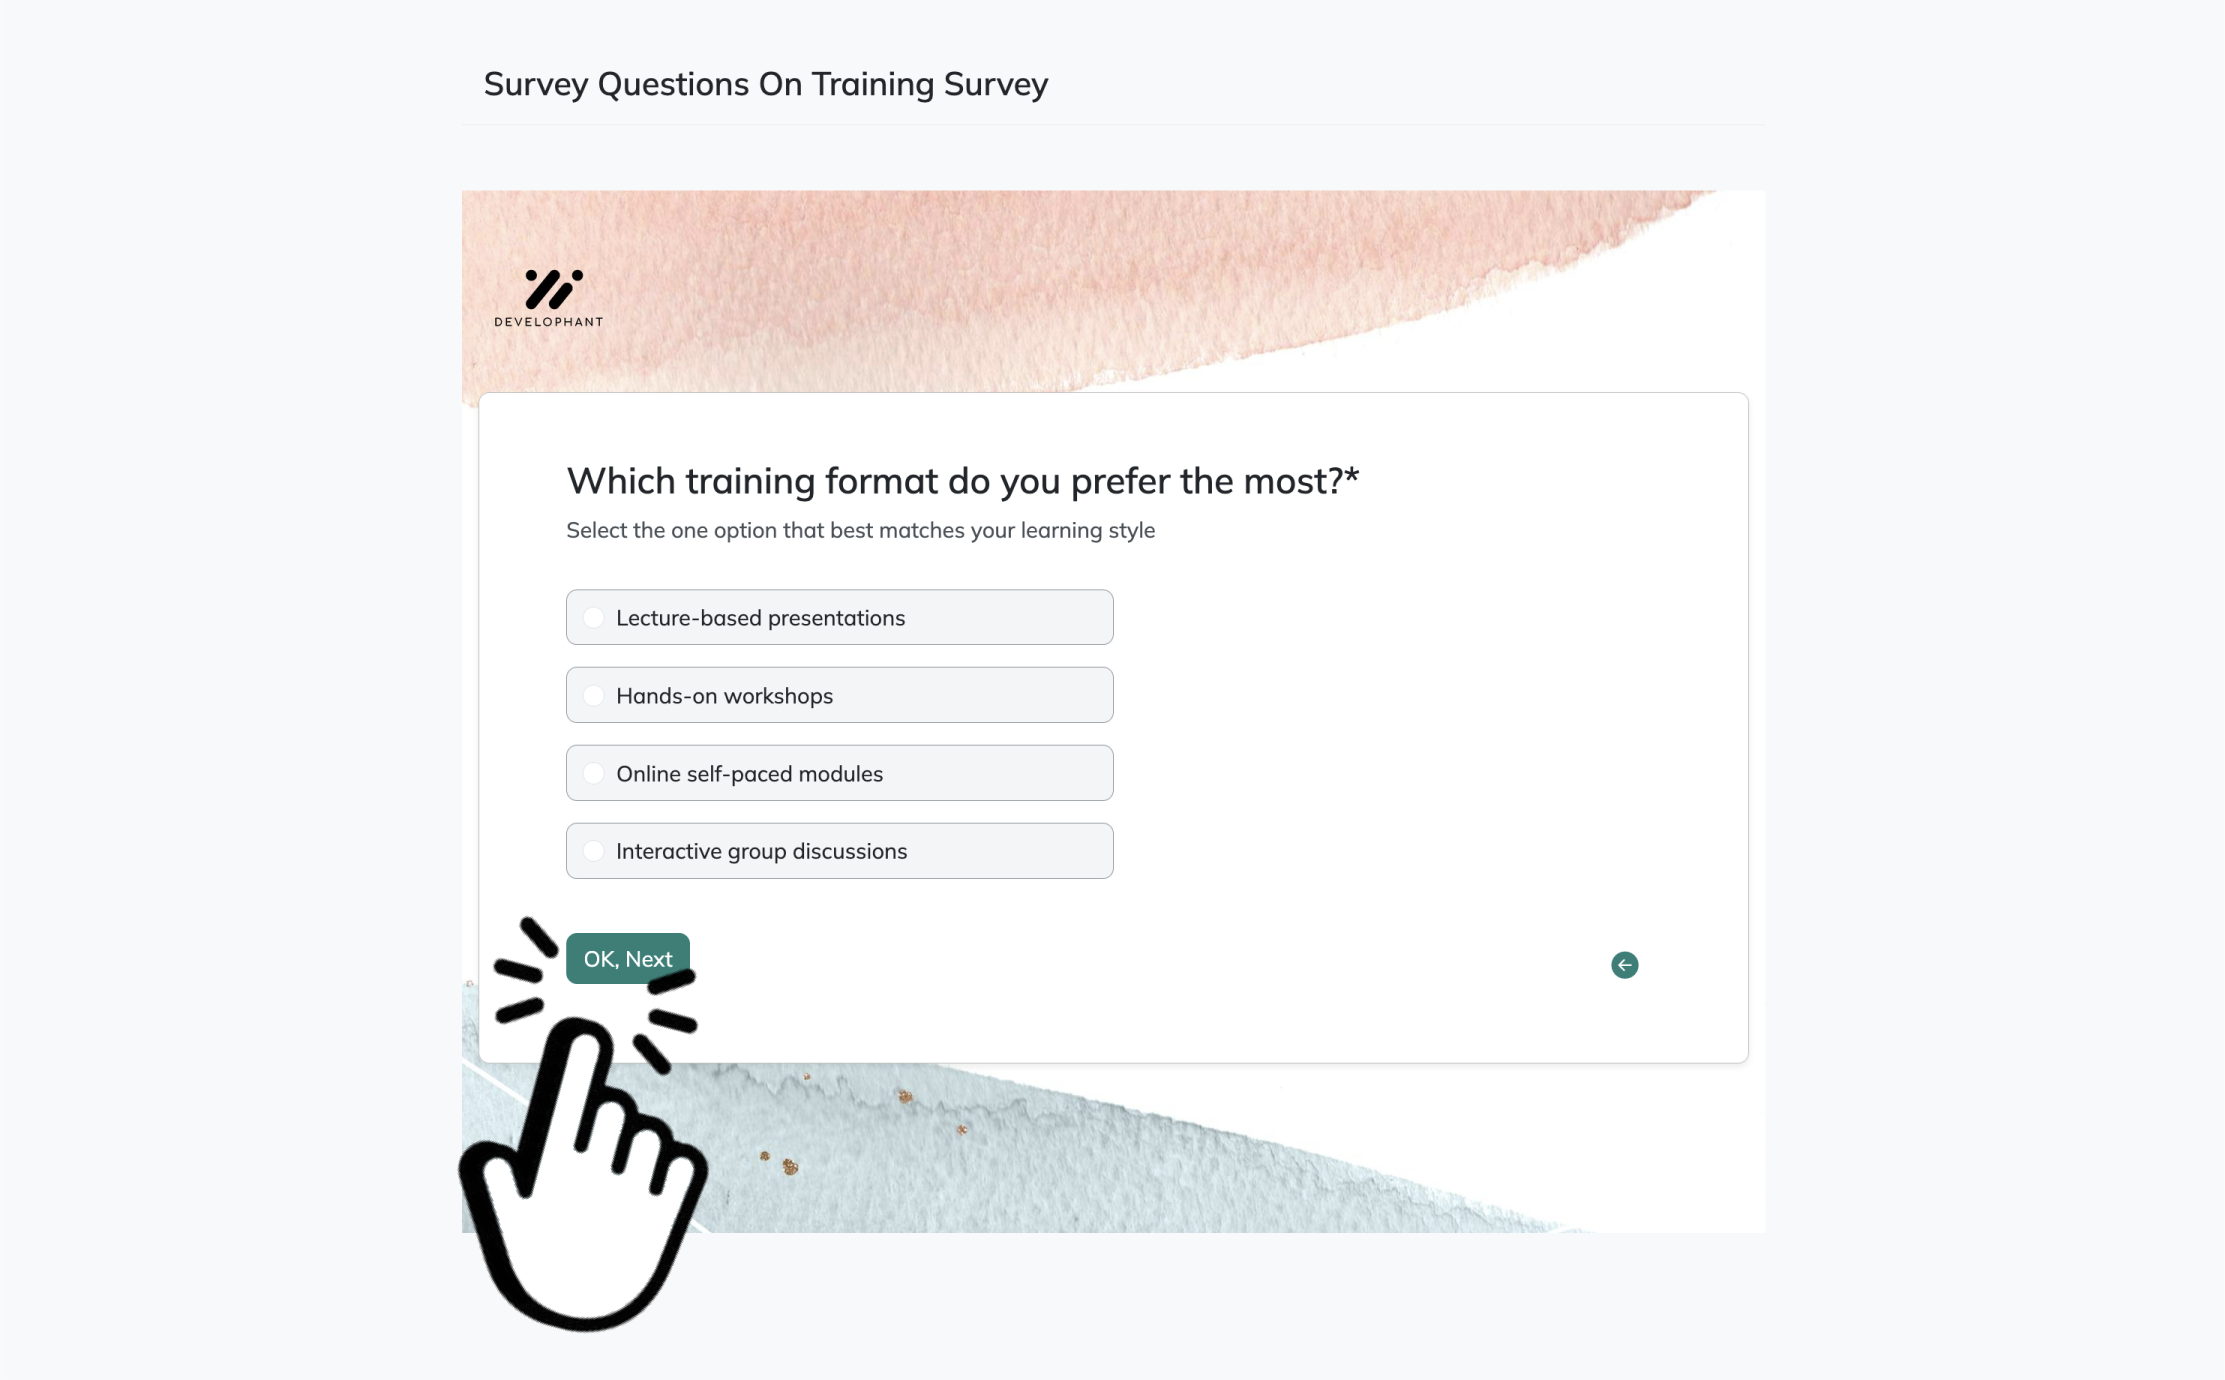
3. Publish survey
Preview your survey to check the flow, then click Publish when you’re ready. HeySurvey will create a shareable link you can send to participants. After publishing, you can collect responses and view charts and summaries in the Results page.
Likert Scale Questions
They show how strongly people feel, not just what box they picked.
Likert scale questions help you measure attitudes, perceptions, and levels of agreement in a way that is easy to compare later.
Instead of a flat yes or no, you get intensity, which is where the useful stuff usually hides.
Here’s the thing: these questions are perfect when you want to understand how positive, negative, or neutral someone feels about something.
They work especially well for:
satisfaction studies
brand perception research
training feedback surveys
employee sentiment surveys
UX research
Common formats use 5-point or 7-point scales, and both can work well depending on how much detail you want.
A 5-point scale keeps things simple, while a 7-point scale gives you a little more nuance without making people feel like they need a PhD to answer.
Plus, consistency matters a lot here.
Keep your scale labels the same throughout the survey so people do not have to mentally switch gears from one question to the next.
Also, do not mix agreement, satisfaction, and frequency scales unless there is a clear reason to do it.
On top of that, balance positively and neutrally worded prompts to reduce bias and keep results more trustworthy.
Why & When to Use
Use Likert scale questions when you need to track strength of opinion, not just whether someone said yes or no.
They are especially useful when you want cleaner comparisons across groups, time periods, or experiences, with less guesswork and fewer shrug-shaped answers.
Sample questions
Which of the following best describes your primary reason for purchasing our product?
How did you first hear about our brand?
Which device do you use most often to access our service?
What is your current employment status?
Which subscription plan are you currently using?
Research shows 5-point and 7-point Likert scales produce highly comparable results, with score conversions explaining over 85% of variance (source).
Multiple-Choice Questions
They make sorting people into useful groups fast, clean, and surprisingly painless.
Multiple-choice questions are great when you already know the kinds of answers people are likely to give.
They help you segment respondents and spot patterns in preferences, behaviors, and demographics without turning analysis into a wild goose chase.
Here’s the thing: these questions work best when answer choices are clear, complete, and easy to categorize.
They are especially useful for:
audience segmentation
campaign attribution
product usage tracking
demographic profiling
subscription or plan analysis
Plus, they are ideal for fast reporting.
You can filter responses, compare groups, and run cross-tab analysis much more easily when everyone is choosing from the same set of options.
It also helps to know whether your question should be single-select or multi-select.
Use single-select when only one answer should apply, and multi-select when respondents may honestly fit more than one category.
On top of that, make options mutually exclusive whenever possible so people do not get stuck choosing between two technically correct answers.
Avoid answer lists that are too long, overlapping, or oddly incomplete.
And only add “Other” when there is a real chance your list misses something important, not just because it feels polite.
Why & When to Use
Use multiple-choice questions when the likely answers are known in advance and you want clean, structured data.
They are especially handy when you need faster analysis, easier filtering, and clearer comparisons across respondent groups.
Sample questions
Have you purchased from our company in the past 12 months?
Are you currently employed full-time?
Did you attend the webinar last week?
Have you used a competitor’s product before?
Would you be interested in joining a follow-up study?
Dichotomous Questions
They give you quick, tidy answers when you need a simple yes or no and not a dramatic monologue.
Dichotomous questions offer just two response options, usually yes/no, true/false, or agree/disagree.
They are perfect when you want fast answers, easy routing, and minimal effort from respondents.
Here’s the thing: these questions work best when the topic is clear, objective, and not open to much interpretation.
They are especially useful for:
screening respondents
validating eligibility
collecting quick factual responses
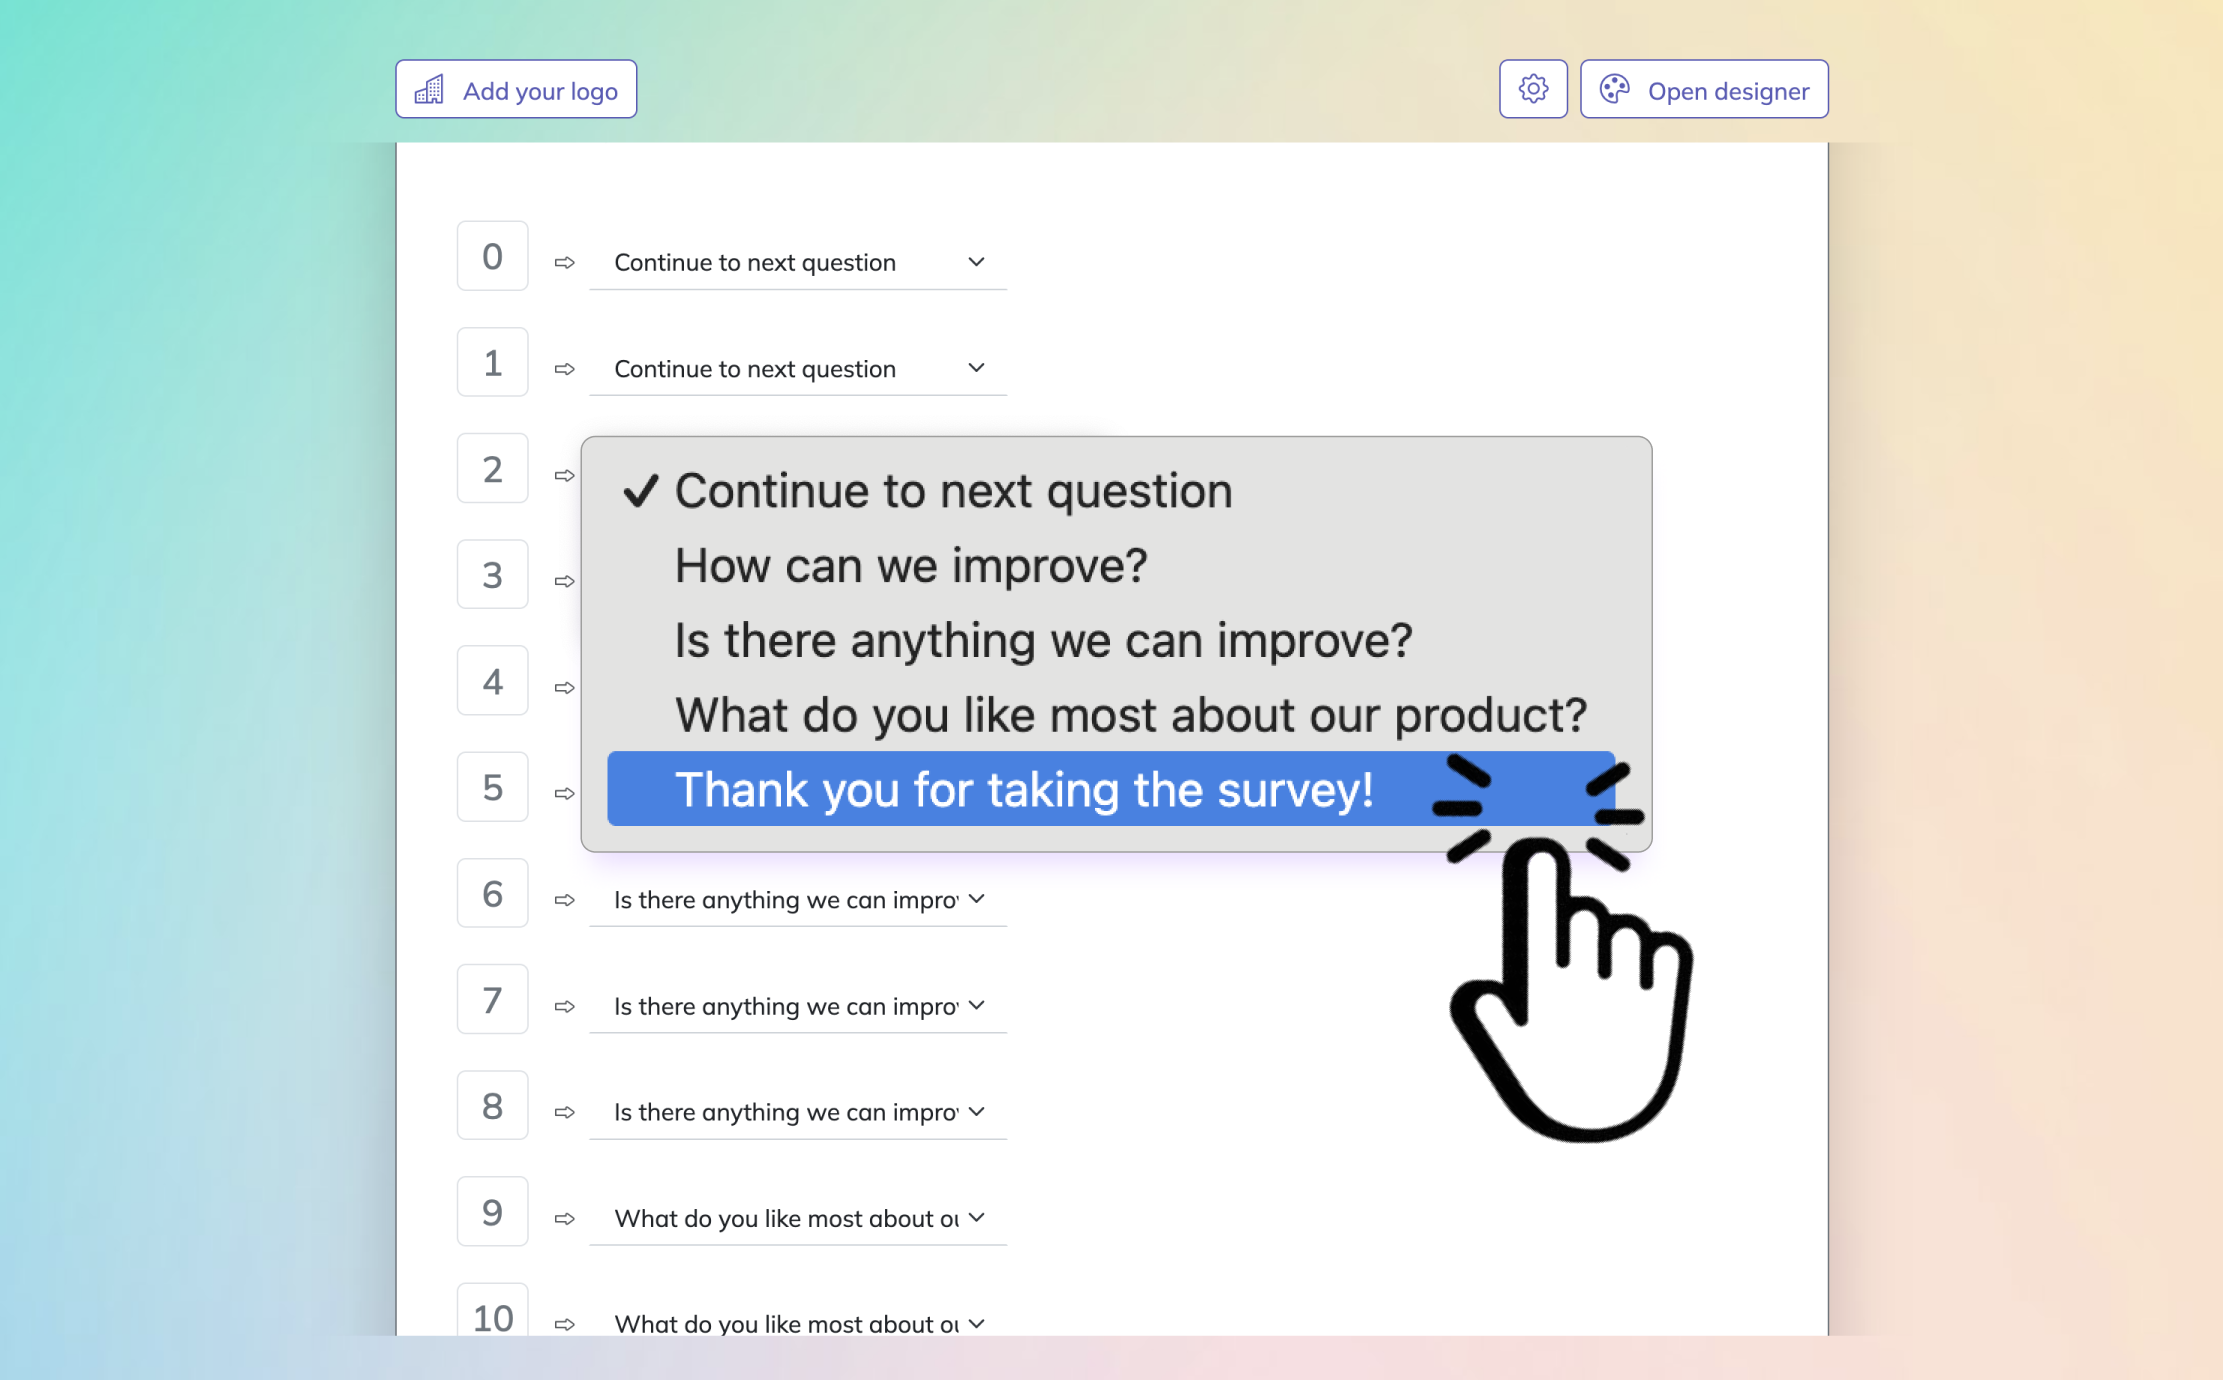
setting up branching logic
improving survey completion speed
Plus, they shine near the beginning of a survey.
You can use them to qualify people quickly, send respondents down the right path, and avoid asking irrelevant questions that make people mentally clock out.
On top of that, wording matters a lot.
If terms like “recently,” “regularly,” or “full-time” are vague, people may answer based on totally different definitions, which is not exactly a data party.
Keep each question precise so respondents know exactly what you mean.
That said, dichotomous questions can flatten more nuanced opinions.
If a topic involves mixed feelings, gray areas, or context, you will usually get better insights by following up with a scaled or open-ended question.
Why & When to Use
Use dichotomous questions when you need simple, fast, factual responses with only two possible answers.
They are especially helpful for qualification, eligibility checks, and early survey branching when speed and clarity matter most.
Sample questions
On a scale of 1 to 10, how would you rate your overall satisfaction with our service?
How would you rate the quality of our product packaging from 1 to 5?
On a scale of 1 to 10, how easy was the checkout process?
How would you rate the usefulness of this report from 1 to 5?
On a scale of 1 to 10, how likely are you to purchase from us again?
Research shows skip sequencing with yes/no screening questions can reduce respondent burden and interview costs, though it may also spread data-quality problems across items (source).
Rating Scale Questions
They help you measure how much, how good, or how easy something feels without forcing people into a plain yes or no.
Rating scale questions ask respondents to score an experience, feature, or outcome using a numeric range like 1 to 5 or 1 to 10.
They are especially handy when you want to measure intensity, quality, performance, or satisfaction in a clean, trackable way.
Here’s the thing: unlike Likert questions, rating scales usually measure a specific dimension such as ease, quality, or usefulness, not just agreement with a statement.
They work especially well for:
customer experience surveys
service quality feedback
product feature evaluation
event and webinar feedback
benchmarking results over time
Plus, your scale size should match the level of detail you need.
Use 1 to 5 when you want quick answers and simpler analysis, and use 1 to 10 when you want finer differences between responses.
On top of that, always label your endpoints clearly, like 1 = Very difficult and 10 = Very easy.
Do not switch scale direction midway through a survey unless confusing people is your secret hobby.
Consistent numeric scales make comparisons easier, especially when you are tracking performance month after month.
Why & When to Use
Use rating scale questions when you want respondents to evaluate intensity, quality, ease, satisfaction, or likelihood on a numeric scale.
They are ideal for customer feedback, service reviews, product assessments, and event surveys, especially when you want benchmark data you can compare over time.
Sample questions
Rank the following product features from most important to least important.
Rank these factors based on what most influences your purchase decision: price, quality, convenience, brand reputation, customer support.
Rank the following communication channels by preference: email, phone, live chat, social media, SMS.
Rank these training topics based on relevance to your role.
Rank the following reasons for canceling a subscription from most common to least relevant.
Ranking Questions
They help you uncover what matters most when people have to choose, compare, and prioritize.
Ranking questions ask respondents to place options in order, usually from most important to least important or most preferred to least preferred.
Here’s the thing: they do not let people say everything matters equally, which is exactly why they are so useful.
When you need comparative insight instead of separate scores, ranking questions do the job better than rating scales.
They are especially useful for:
feature prioritization
content and channel preferences
buying criteria analysis
subscription or product feedback
market positioning research
Plus, ranking reveals trade-offs clearly.
If someone ranks price first, brand reputation usually cannot also sit proudly in first place wearing the same crown.
Keep your option list short so the task stays manageable.
A good rule is to limit ranking questions to 5 to 7 items, because long lists can tire respondents out and lead to rushed, random answers.
On top of that, make every item crystal clear.
If options overlap or sound vague, respondents may rank inconsistently, and your data gets messy fast.
Why & When to Use
Use ranking questions when you want people to prioritize options based on importance, relevance, or preference.
They work best for feature planning, content strategy, purchase decision research, and positioning studies, especially when you need to understand trade-offs instead of standalone opinions.
Sample questions
How often do you use our mobile app each week?
How frequently do you purchase products in this category?
How often do you contact customer support?
How frequently do you read our email newsletter?
How often do you work remotely in a typical month?
Frequency Questions
They show you how often something actually happens, not just whether it happens at all.
Frequency questions measure how often a behavior, action, or experience occurs over time.
Here’s the thing: that makes them perfect when you want real patterns, not fuzzy guesses dressed up as insight.
Use them for things like:
usage studies
purchase habits
media consumption
exercise routines
service interaction analysis
Plus, they help you quantify behavior in a way that is easy to compare across groups.
That means you can spot high-value users, low-engagement segments, and everyone in between without needing a crystal ball.
To get strong data, always use clearly defined timeframes.
Daily, weekly, monthly, or yearly works far better than vague choices like “sometimes” or “regularly,” because those words mean wildly different things to different people.
On top of that, match the response intervals to the behavior you are measuring.
A weekly app habit might need options like “daily” or “a few times a week,” while an annual purchase category should use much wider intervals.
Why & When to Use
Use frequency questions when you want to measure how often people do something, experience something, or interact with your product or service.
They work especially well for tracking habits, comparing audience segments, and identifying patterns over time, especially when you need clear behavioral data instead of general opinions.
Sample questions
Is each survey question tied to a clear research goal?
Does this question ask only one thing at a time?
Are the answer choices complete, clear, and easy to tell apart?
Would a first-time respondent understand this wording right away?
Did you test this survey before sending it to everyone?
Best Practices for Writing Quantitative Research Survey Questions
Good survey questions feel easy to answer and hard to misread.
Here’s the thing: strong quantitative surveys are built for reliability, validity, and respondent ease all at once.
That means every question should connect to a specific objective, use simple wording, and ask about one idea only.
Your scales should stay consistent and follow a logical order, because flipping formats halfway through is a fast way to confuse people and muddy your data.
Dos
Use these habits to keep your survey clean and useful:
Align every question with a research goal.
Use simple, specific wording.
Keep response options exhaustive and non-overlapping.
Pilot test before full launch.
Use neutral phrasing to reduce bias.
Keep the survey concise for your audience’s motivation level.
Plus, match survey length and complexity to how much effort respondents are likely to give you, because even great questions fail when people are mentally already at lunch.
Don’ts
Watch out for these common traps:
Don’t ask double-barreled questions like “Was the product useful and affordable?”
Don’t use leading or loaded wording like “How great was your experience?”
Don’t use vague timeframes like “recently” or jargon people may interpret differently.
Don’t switch scale direction unnecessarily.
Don’t force rankings or ratings when people lack context.
Don’t overuse “Other” or ask sensitive demographics without a clear reason.
Don’t ignore question order effects, since earlier questions can shape later answers.
Why & When to Use
Use these best practices any time you want data you can trust, compare, and act on confidently.
On top of that, they matter most when your survey results will guide decisions, because clean question design saves you from bad insights with very tidy charts.
Sample questions
Could two people read this question and interpret it differently?
Are the response scales consistent from one question to the next?
Does this survey reach the right people for the research goal?
Is the survey short enough that respondents will finish with care?
Could earlier questions influence how people answer later ones?
Common Mistakes to Avoid With Quantitative Survey Design
Even smart questions can fall apart inside a messy survey.
Here’s the thing: quantitative survey design is not just about writing decent questions.
It is also about building a structure that gives you clean, trustworthy data instead of a spreadsheet full of polite chaos.
Ambiguous wording is one of the biggest problems, because if people interpret a question in different ways, their answers cannot be compared reliably.
That means the data may look neat, but it will not mean much, which is a bit like putting racing stripes on a shopping cart.
Poorly designed scales cause trouble too, especially when labels are inconsistent, overlap, or change direction halfway through.
A 1 to 5 scale in one question and a 1 to 10 scale in the next can confuse respondents.
Labels like “often” and “sometimes” may blur together if you do not define them clearly.
Reversed scale order can create avoidable analysis errors.
Plus, sampling mismatch can sink the whole project if you survey people who do not actually represent the group you want to study.
Survey fatigue matters too, because long or repetitive surveys lead to rushed answers, drop-offs, and straight-lining.
On top of that, question-order bias can shape responses, so even strong sample questions may fail if the survey flow is weak.
Why & When to Use
Use this checklist when reviewing any survey before launch, especially if the results will support decisions, reports, or comparisons over time.
Plus, catching these mistakes early helps you protect data quality before your respondents start clicking first and thinking later.
Sample questions
How does each survey question connect to the decision you need to make?
Which results should be grouped by segment, trend, or priority first?
What actions can you take based on the strongest survey patterns?
Did you choose the right question type for the insight you wanted?
How will you measure whether the changes actually improved results?

How to Turn Survey Insights Into Action
Better question types lead to better decisions, not just better charts.
Here’s the thing: a quantitative survey is only useful if the results help you do something smarter next.
When you choose the right survey question type, you get cleaner data, clearer patterns, and decisions that are based on evidence instead of educated guessing with extra confidence sprinkled on top.
Before launch, map every question to a goal.
A business goal might focus on improving conversion, retention, or product satisfaction.
An academic goal might aim to test a hypothesis or compare groups consistently.
An operational goal might track service quality, training gaps, or internal process issues.
Plus, once responses come in, do not just read the averages and call it a day.
Group findings by:
Segment, such as customer type, department, location, or experience level.
Trend, such as changes over time or movement after a specific update.
Priority, such as what affects satisfaction, efficiency, or outcomes most.
Then turn insights into action.
Update product features.
Improve content or messaging.
Fix customer support pain points.
Strengthen employee experience initiatives.
Why & When to Use
Use this approach when you want survey data to guide real decisions, not just decorate a slide deck.
Start with a clear objective, pick the right question type, test the survey, and use the results to make measurable improvements.
Related Surveys
31 Social Media Survey Questions
Explore 25 social media survey questions with sample examples to boost engagement insights, audie...
29 Job Satisfaction Survey Questions
Explore 25 job satisfaction survey questions with sample responses to measure employee morale, fe...
28 Quantitative Survey Questions
Explore 25 quantitative survey questions with sample questions, examples, and tips to create clea...