31 Ordinal Survey Questions
Explore 25 sample ordinal survey questions with examples and insights to help you understand response scales, analyze data, and improve surveys.
You use ordinal survey questions when answers follow a clear order, but the gaps between choices are not equal. They matter in feedback forms, market research, employee surveys, and customer experience because they turn opinions into patterns you can actually use. Plus, this guide walks you through ordinal questions, ordinal survey questions examples, and ordinal scale questions so you can choose the right format, write better surveys, and make sense of the results without needing a statistics cape. If you need a reliable online survey maker, it can help you build these question types quickly.
Sample questions
What makes ordinal survey questions different from other question types?
How do ordinal questions rank responses without measuring exact gaps?
What is a simple ordinal question example I can use in a survey?
What Are Ordinal Survey Questions?
Ordinal survey questions examples usually ask people to choose from responses that go in a clear order.
In plain language, ordinal questions let you measure position or rank, not exact amounts. You use them when you want to know whether something is higher, lower, better, worse, more, or less.
Here’s the thing: the answer choices follow a sequence, but the space between them is not guaranteed to be equal. So if someone picks "satisfied" and another picks "very satisfied," you know one is higher than the other, but not exactly how much higher.
A classic ordinal data example questions format looks like this:
Very dissatisfied
Dissatisfied
Neutral
Satisfied
Very satisfied
That is one of the most common ordinal questions examples because the responses are ranked from low to high. Simple, useful, and thankfully not allergic to clarity.
Plus, this is what separates ordinal questions from other data types:
Nominal data names categories with no order, like favorite color.
Interval data has equal gaps, like temperature in Celsius.
Ratio data has equal gaps and a true zero, like age or income.
So, an ordinal questionnaire example gives you ordered feedback, but not precise mathematical distance. On top of that, this makes ordinal scale questions perfect for opinions, ratings, and good survey questions experience levels.
Sample questions
How satisfied are you with our customer support?
How strongly do you agree that our product is easy to use?
How satisfied are you with the speed of our delivery process?
How strongly do you agree that your manager communicates clearly?
How likely are you to say our onboarding process met your expectations?
Ordinal survey questions measure ranked categories like satisfaction or agreement, but distances between response options are uneven or unknown (Source).
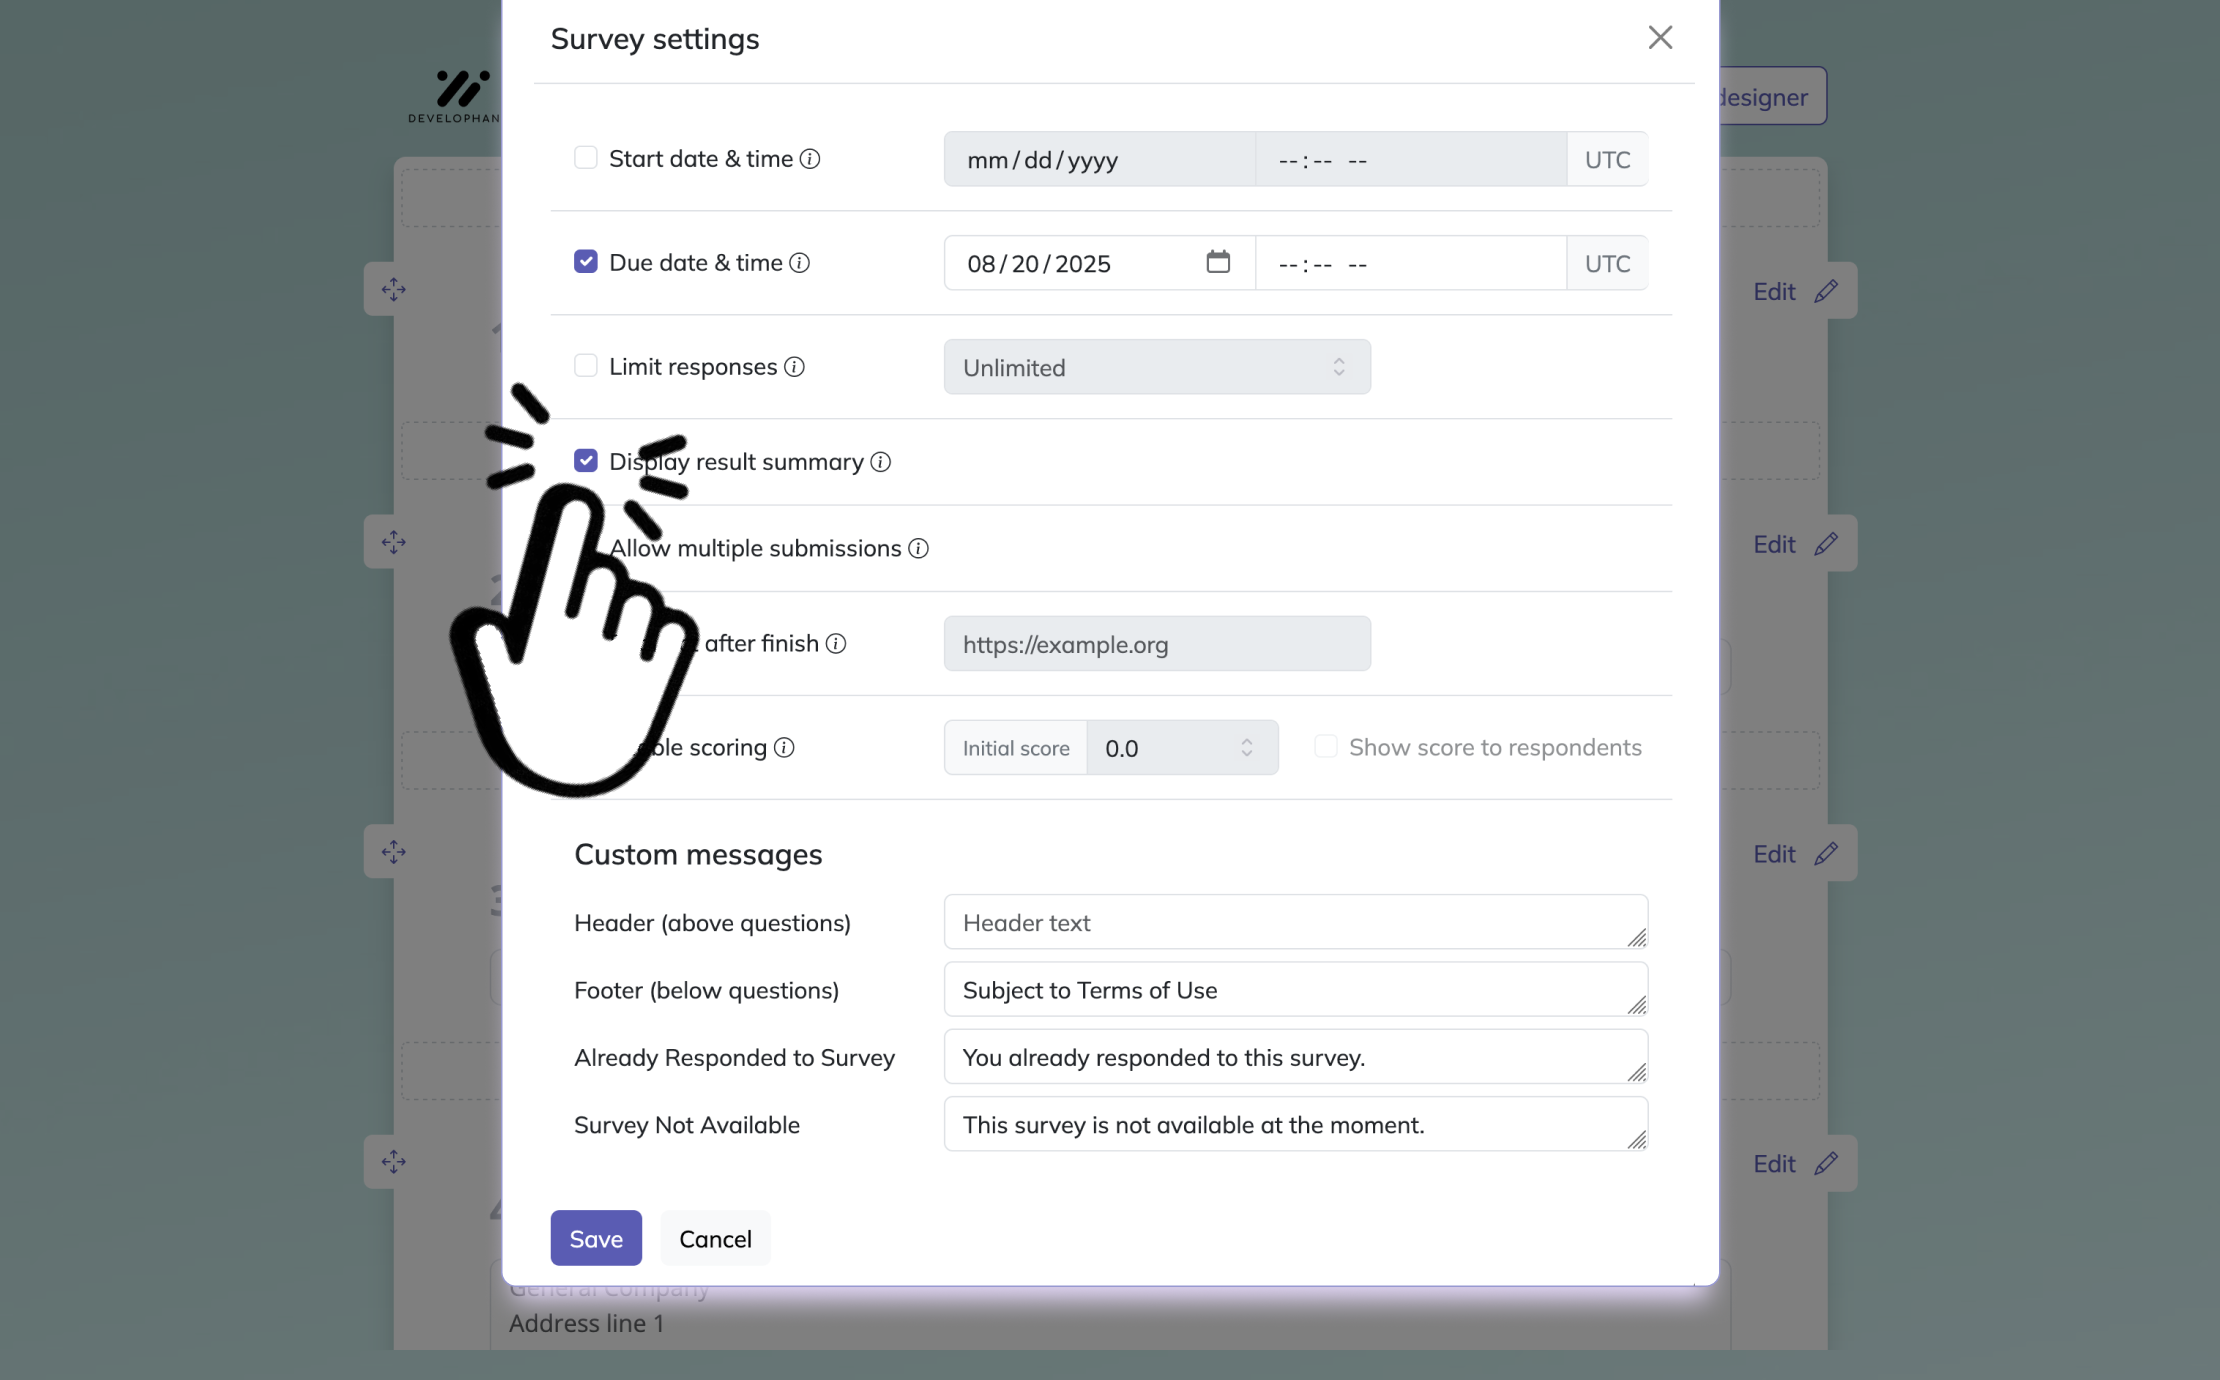
Create an ordinal survey in HeySurvey in just a few minutes:
Create a new survey
Start by opening HeySurvey, a free survey software, and choosing a template with the button below, or begin with an empty sheet. This opens the survey editor, where you can name your survey and adjust basic settings. If needed, you can also add your logo and choose a layout that fits your survey.Add questions
Click Add Question and choose a Scale, NPS, or Choice question, depending on how you want respondents to rank or rate items. Write clear ordinal response options, such as “Strongly disagree” to “Strongly agree,” and mark questions as required if every answer matters. You can also add descriptions, reorder options, and customize the look and feel.Publish survey
Review your survey in Preview mode to make sure the order and wording feel right. When everything is ready, click Publish to get a shareable link. Your ordinal survey is now live, and you can start collecting responses right away.
Likert Scale Ordinal Survey Questions
Likert scales are some of the most recognizable ordinal survey questions examples because they turn feelings into clear, ranked choices.
When people talk about ordinal questions, this is often the format they mean. You give respondents a balanced scale, and they choose where their opinion lands from low to high.
Common response sets include:
Strongly disagree to strongly agree
Very dissatisfied to very satisfied
Very unlikely to very likely
Here’s the thing: these ordinal questions examples work so well because they are structured, familiar, and easy to answer. Your respondents do not have to guess what kind of response you want, which is always a nice little miracle in survey design.
Why & When to Use
Use Likert-style ordinal scale questions when you want to measure attitudes, opinions, satisfaction, agreement, or perception in a consistent way. They are especially useful when you need feedback you can summarize quickly without making the survey feel like homework.
You will see this format everywhere for a reason:
Customer feedback surveys
Employee engagement surveys
Training evaluations
Product and user research
Plus, a good ordinal questionnaire example uses balanced response options, such as two negative choices, one neutral choice, and two positive choices. On top of that, keep the scale direction consistent across questions so people do not accidentally answer backward like they just hit a conversational banana peel.
Sample questions
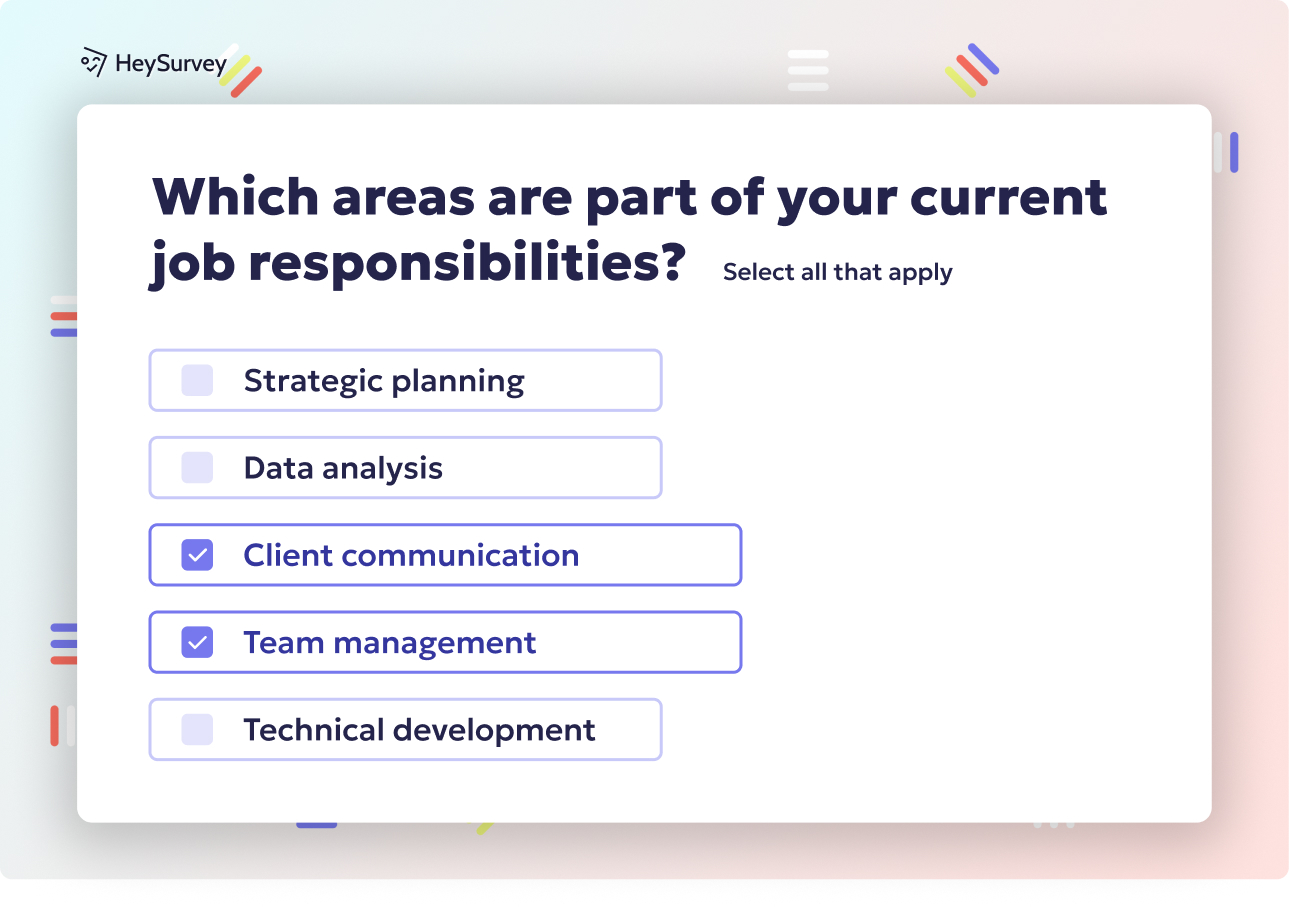
Rank the following product features from most important to least important.
Rank these reasons for choosing our brand in order of importance.
Rank the communication channels you prefer for customer support.
Rank these employee benefits from most valuable to least valuable.
Rank the factors that most influence your buying decision.
Likert items produce ordered, not equally spaced, responses, so individual questions should generally be analyzed as ordinal data rather than interval data (source).
Ranking Questions
Ranking questions are a smart ordinal question example when you want people to show what matters most, not just what they like.
Among common ordinal survey questions examples, ranking stands out because it asks respondents to place options in order of importance, preference, or priority. That makes ranking one of the clearest ordinal questions examples for spotting trade-offs.
Here’s the thing: ranking creates ordered data, which is why it fits neatly into the world of ordinal questions. You learn what comes first, second, or last, but you do not learn the exact distance between each rank.
Why & When to Use
Use ranking-style ordinal questions examples when you need to identify top drivers and competing priorities. They are especially helpful when people may value several things, but you need to know which one wins when everything cannot be number one. Tough love for features, basically.
These ordinal scale questions are especially useful in:
Product development
Pricing research
Event planning
Content strategy
Plus, keep the list of items short so respondents do not get overloaded. On top of that, a focused ordinal questionnaire example is easier to answer accurately, and that means cleaner insights for you.
Sample questions
How often do you use our mobile app?
How often do you contact customer support?
How often do you purchase from our store?
How often do you participate in team meetings?
How often do you recommend our services to others?
Frequency Scale Questions
Frequency scale questions are classic close ended survey questions examples because they measure how often something happens in a clear, ordered way.
If you want to track behaviors, habits, or repeated experiences, frequency-based ordinal questions are a great fit. Common answer choices like “never,” “rarely,” “sometimes,” “often,” and “always” follow a natural order, which makes them strong ordinal questions examples.
Here’s the thing: these responses show rank, not exact distance. So while frequency scales tell you one group engages more often than another, they do not tell you the precise gap between “sometimes” and “often.”
Why & When to Use
Use these ordinal survey questions examples when you need to measure how often people do something over time. They work especially well for habit tracking, product usage, service interactions, and engagement measurement.
They are especially useful for:
Tracking customer or employee behavior
Measuring product or feature usage
Spotting patterns over time
Segmenting users by activity level
Monitoring service touchpoints
Plus, a good ordinal questionnaire example often includes a time frame, such as “in the past 30 days,” to improve accuracy. On top of that, defined timing helps respondents answer from memory instead of pure guesswork, which is always a nice plot twist.
Sample questions
How satisfied are you with the quality of our product?
How satisfied are you with the checkout experience?
How satisfied are you with the clarity of our pricing?
How satisfied are you with your work-life balance?
How satisfied are you with the training you received?
Frequency-based ordinal survey scales rank behaviors in order, but they do not measure equal intervals between categories like “sometimes” and “often” (Source).
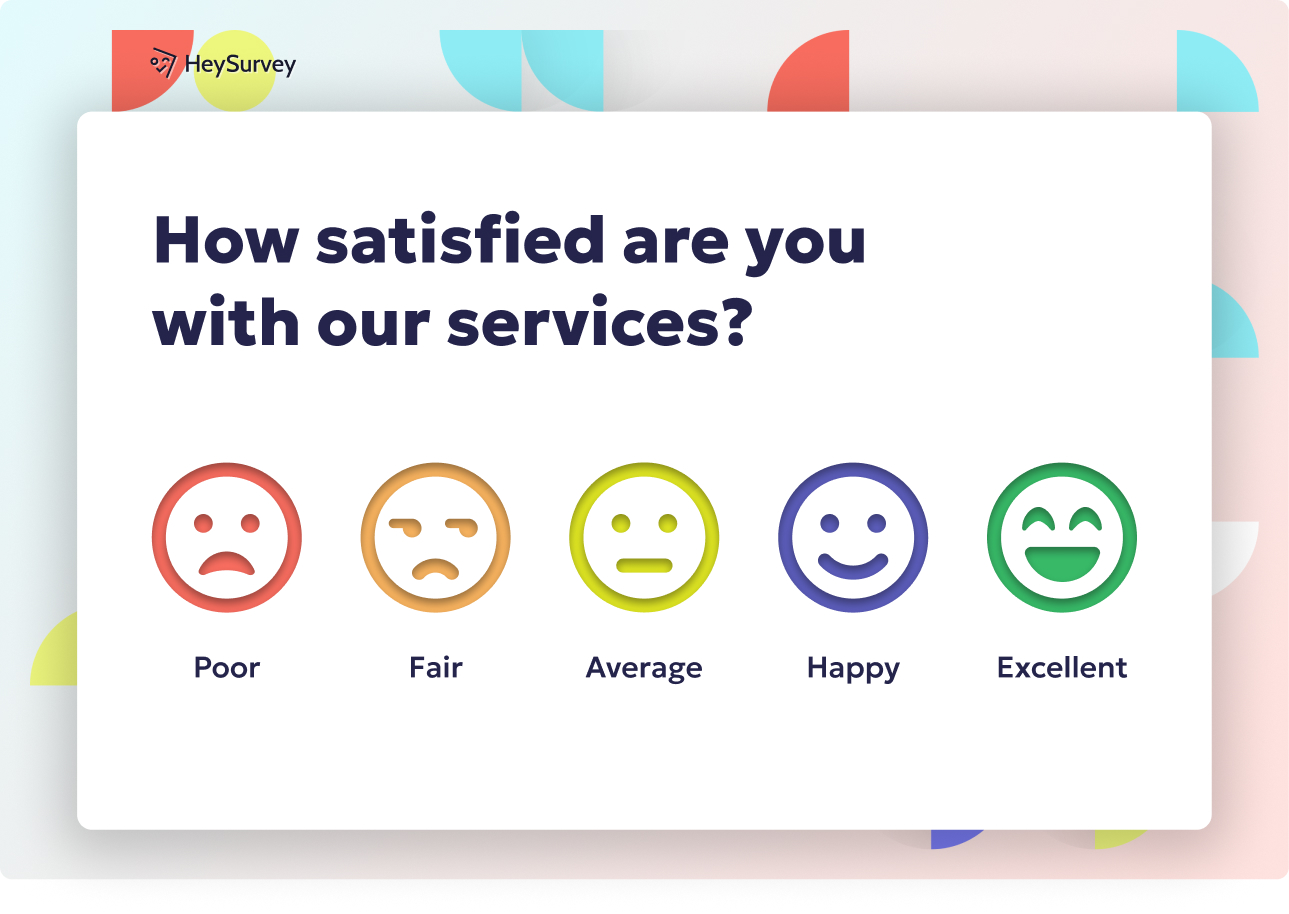
Satisfaction Scale Questions
Satisfaction scale questions are some of the most useful ordinal survey questions examples when you want to measure how people feel about a specific experience.
These ordinal questions help you assess satisfaction with products, services, processes, events, or everyday interactions. Common response options like “very dissatisfied” to “very satisfied” follow a clear order, which makes them strong ordinal questions examples for feedback that is easy to compare.
Here’s the thing: satisfaction scales are not quite the same as agreement scales. A statement like “I agree this product is easy to use” measures agreement, while “How satisfied are you with this product?” measures the quality of the experience, and that difference matters more than people think.
Why & When to Use
Use these ordinal scale questions when your goal is to spot what is working well and what needs attention. They fit especially well in customer experience surveys, post-purchase surveys, employee pulse checks, and healthcare feedback.
They are especially helpful for:
Evaluating product and service performance
Identifying pain points in specific steps or touchpoints
Comparing satisfaction across teams, locations, or time periods
Prioritizing improvements based on low-rated experiences
Tracking changes after updates or training
Plus, a neutral midpoint can be useful, but only when it supports your research goal. If you truly want a clear lean one way or the other, giving respondents a middle option can become the survey version of sitting on the fence.
Sample questions
How important is fast shipping when choosing a retailer?
How important is product customization to you?
How important is career development in your current role?
How important is data security when choosing software?
How important is responsive customer service when evaluating a brand?
Importance Scale Questions
Importance scale questions help you learn what people actually care about, not just what they happen to notice in the moment.
These ordinal survey questions examples ask respondents to rank features, benefits, values, or concerns on an ordered scale like “not at all important” to “extremely important.” That clear order makes them strong ordinal questions examples when you need to separate must-haves from nice-to-haves.
Here’s the thing: importance scales become even more useful when you pair them with satisfaction results. If something scores high in importance but low in satisfaction, you have a bright flashing sign pointing to a high-impact fix.
Why & When to Use
Use these ordinal questions when you want to prioritize improvements, shape your roadmap, or sharpen audience research. They work especially well in product development, customer experience, HR surveys, and brand research.
They are especially helpful for:
Prioritizing features, services, or benefits based on what matters most
Guiding roadmap planning and resource decisions
Comparing importance versus current performance
Identifying gaps between customer expectations and actual experience
Focusing action on high-priority issues instead of chasing every suggestion
Plus, this is where many teams get tripped up. If an item gets complaints but ranks low on importance, it may be more of a squeaky wheel than a real fire, so follow-up analysis keeps you from polishing the wrong doorknob.
Sample questions
How would you rate the quality of our customer service?
How would you rate the reliability of our software?
How would you rate the usefulness of this training session?
How would you rate the cleanliness of our facility?
How would you rate the effectiveness of our communication during the project?

Quality or Performance Rating Questions
Quality or performance rating questions give you quick, directional feedback without forcing people to pretend they know the exact math.
These ordinal survey questions examples ask people to rate perceived quality, usefulness, reliability, or effectiveness on an ordered scale such as “poor” to “excellent.” That makes them strong ordinal questions when you want clear rankings, not fussy precision with a calculator hat on.
Here’s the thing: people are often very good at judging relative performance even when they cannot assign a perfect numeric score. That is why these ordinal questions examples work so well in product testing, course evaluations, service reviews, and internal performance research.
Why & When to Use
Use these practical ordinal questionnaire examples when you need simple, easy-to-compare feedback about how well something performs. They are especially useful when respondents can spot quality differences but exact numbers would add more confusion than clarity.
They work well for:
Evaluating perceived quality, effectiveness, or performance on an ordered scale
Reviewing training sessions, customer support, software, facilities, or team communication
Collecting directional feedback for products, services, and internal processes
Turning subjective opinions into consistent ordinal scale questions your team can track over time
Plus, keep your response options crystal clear, such as “poor,” “fair,” “good,” and “excellent.” Vague labels create mushy data, and mushy data is about as helpful as a screen door on a submarine.
Sample questions
Which set of response options is clearer for satisfaction: “poor to excellent” or “bad to amazing”?
How can you improve weak ordinal questions examples that use overlapping labels like “sometimes” and “often”?
When should you define a time frame in ordinal survey questions examples about behavior or frequency?
Why is it important to keep scale direction consistent across ordinal questions?
What makes ordinal questions examples easier to translate for multilingual audiences, including people searching for preguntas ordinales?
Best Practices for Writing Ordinal Survey Questions
Great ordinal questions feel effortless to answer and easy to analyze later, which is a lovely combo.
When you write ordinal survey questions examples, your job is to make the order obvious and the wording clean. Here’s the thing: strong ordinal questions examples reduce hesitation, while messy ones make people guess.
Why & When to Use
Use these tips when you want better ordinal questions for satisfaction, frequency, importance, or agreement. Plus, they help when you are refining an ordinal questionnaire example for broad audiences and clearer comparisons.
Dos
Use clearly ordered response options.
Good: “Never, Rarely, Sometimes, Often, Always”
Weak: “Rarely, Always, Sometimes, Never”Keep labels intuitive and distinct.
Good: “Low, Medium, High”
Weak: “Sometimes, Frequently”Match the scale to the goal.
Satisfaction needs rating labels, while frequency needs time-based order.Keep direction consistent across the survey.
Define time periods for behavior questions, like “in the past 30 days.”
Test your ordinal scale questions before launch.
Use simple, neutral wording that translates well for multilingual audiences, including preguntas ordinales.
Don'ts
Do not cram two ideas into one item.
Weak: “How satisfied are you with the price and quality?”Do not use overlapping categories.
Do not flip scale direction from question to question.
Do not treat ordinal choices like perfectly equal intervals.
Do not overload people with too many ranking items. Your respondents are helpful, not training for a decathlon.
Do not use loaded wording or overly long scales without a real payoff.
Sample questions
What are the most common mistakes people make when writing ordinal survey questions examples?
How do vague labels weaken ordinal questions examples and confuse respondents?
When should you include a neutral or “not applicable” option in ordinal questions?
Why is forcing people to rank too many items a bad idea in ordinal survey questions examples?
How can you fix an ordinal question example that does not match your research goal?
Common Mistakes to Avoid With Ordinal Questions
Small wording mistakes can quietly wreck good data, which is rude of them, honestly.
Poorly written ordinal questions create confusion, lower completion rates, and make comparisons shaky. Here’s the thing: if people are unsure how to answer, your ordinal survey questions examples stop measuring what you think they measure.
Why & When to Use
Use this checklist when reviewing ordinal questions examples before launch or cleaning up an existing ordinal questionnaire example. Plus, it helps when you want stronger data quality and clearer reporting from your ordinal scale questions.
Common mistakes to watch for:
Vague labels.
Weak: “How often do you use the app? Sometimes, Regularly, A lot”
Better: “Never, Rarely, Sometimes, Often, Daily”Inconsistent scale lengths across similar ordinal questions examples.
A 5-point scale in one item and a 7-point scale in another can hurt comparability.Missing options when needed.
If some people cannot judge an item, add “Neutral” or “Not applicable.”Forcing rank choices across too many items.
Ranking 12 features is tiring fast, and tired respondents do not give lovely data.Treating ordinal results like exact interval measures.
“Satisfied” to “Very satisfied” shows order, not precise equal distance.Misaligned questions.
Weak: asking satisfaction when your goal is frequency.
Better: use a frequency-based ordinal question example instead.
Sample questions
How do you turn ordinal survey questions examples into real business decisions?
What patterns should you look for in high, medium, and low ordinal questions results?
How can satisfaction, importance, and frequency work together in ordinal questions examples?
Why should you segment ordinal survey questions examples by audience or location?
How do trends over time help you act on ordinal question example results?
How to Turn Ordinal Survey Insights Into Action
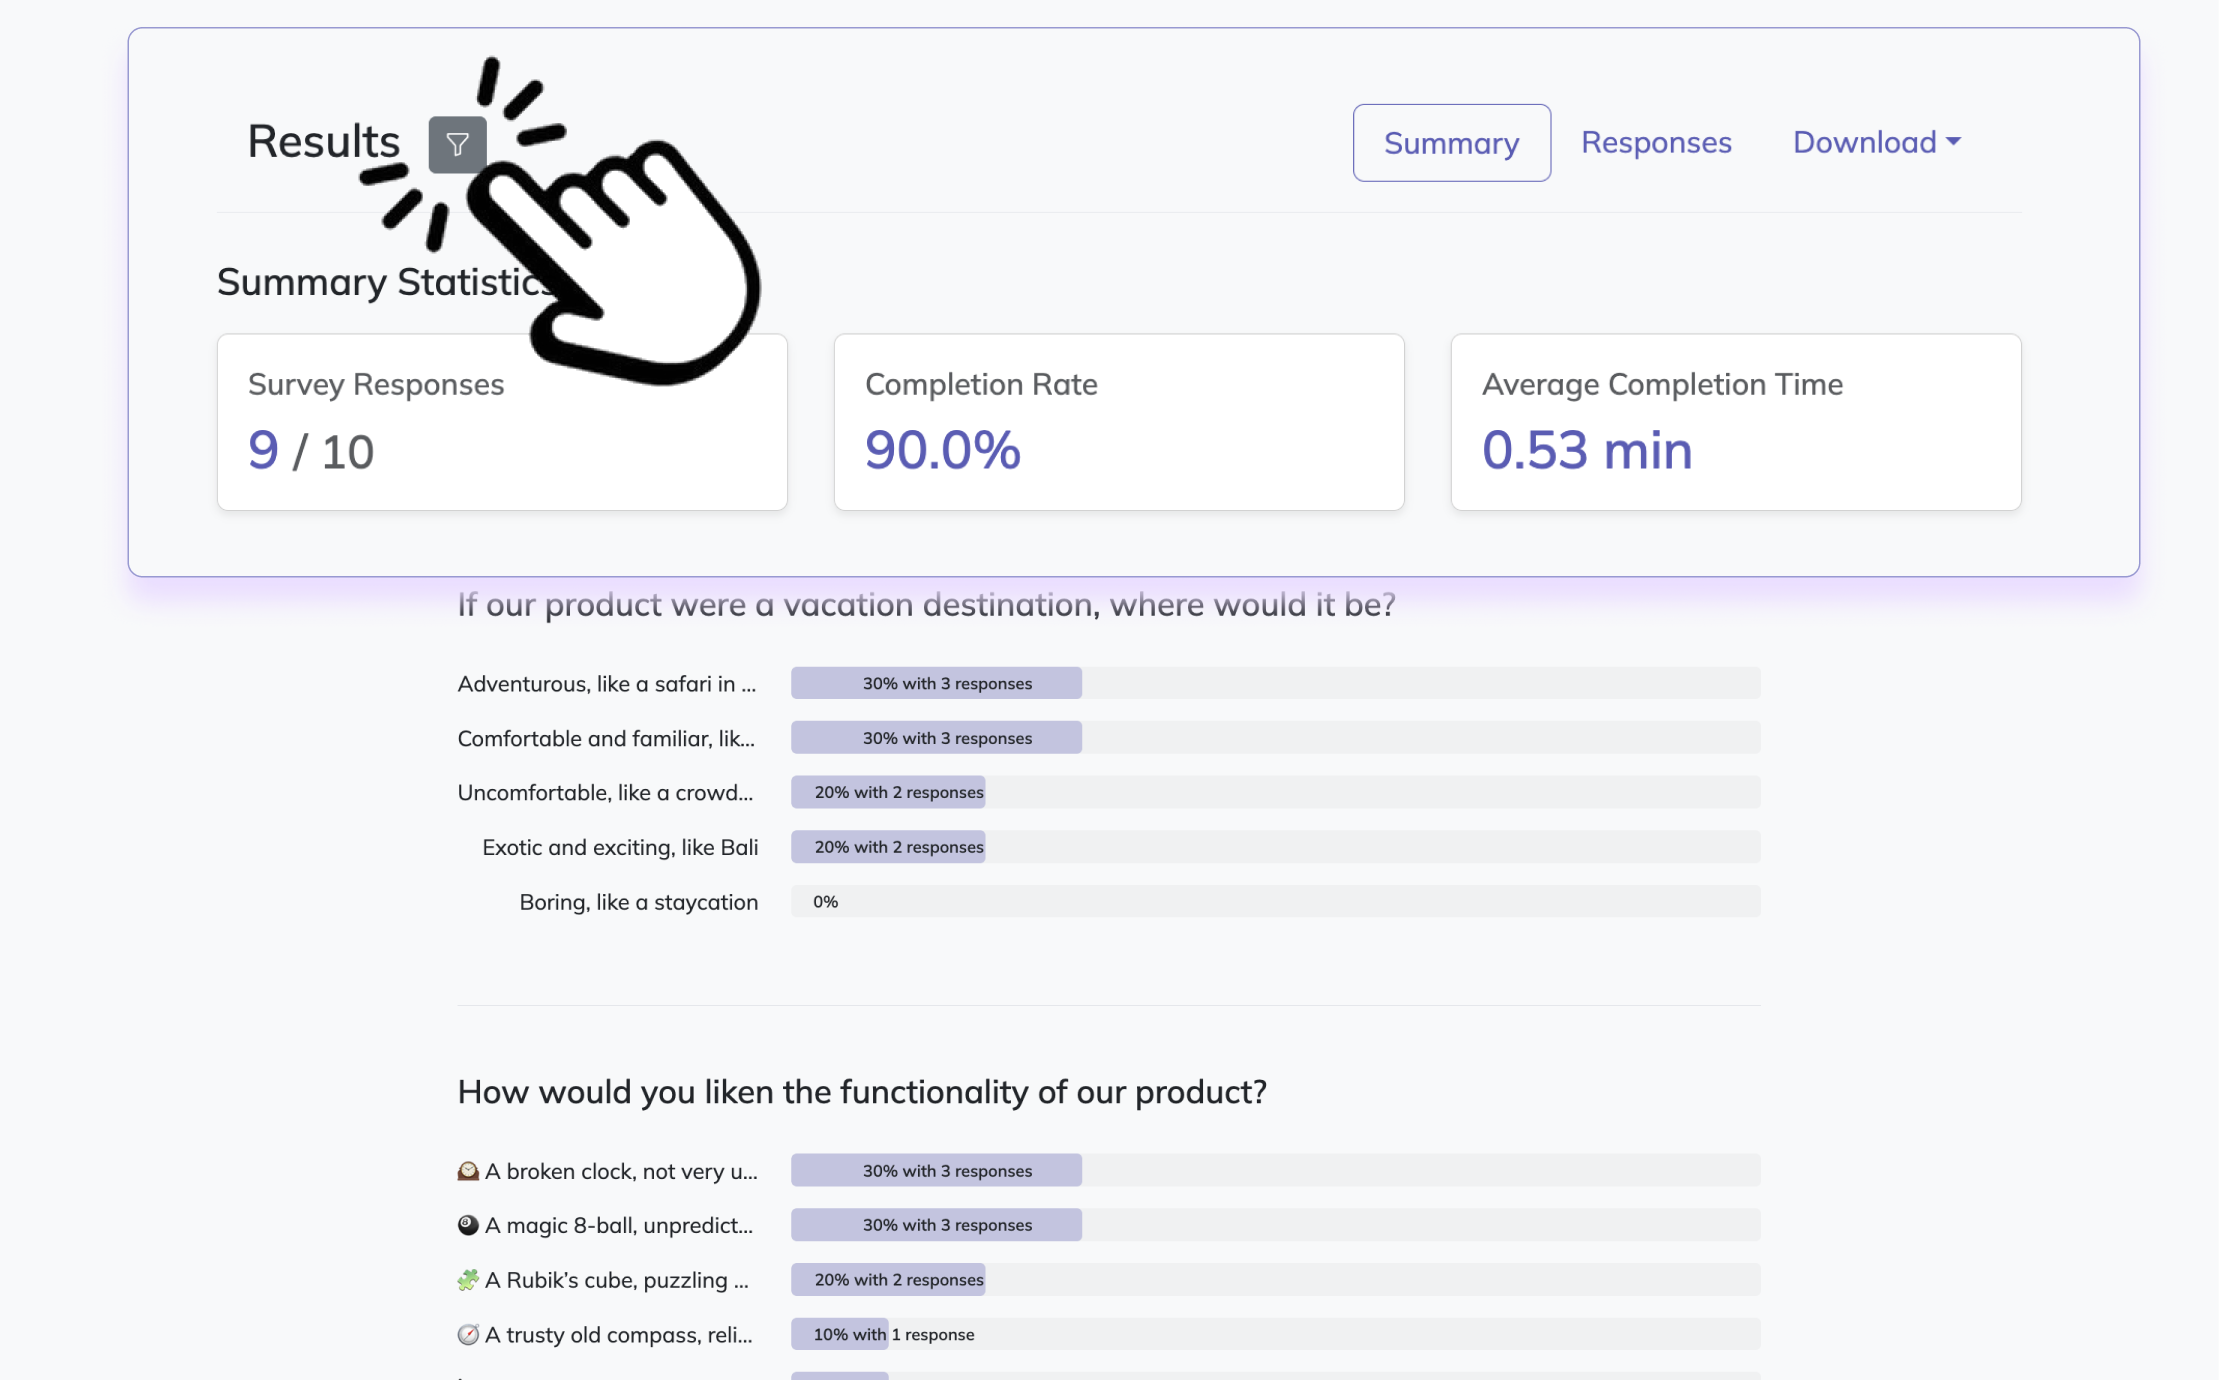
Good survey data earns its keep when you actually do something with it.
Once your ordinal survey questions examples are live, start by reviewing where responses cluster. High scores show strengths to protect, mid-range scores often point to uncertainty, and low scores usually wave a giant flag that says, "please fix this."
Why & When to Use
Use this step after collecting responses from ordinal questions so you can move from tidy charts to useful decisions. Plus, it helps you spot what matters most instead of chasing every tiny complaint like a squirrel after glitter.
A smart way to prioritize is to combine multiple signals from your ordinal questions examples:
Low satisfaction + high importance = urgent problem
High frequency + low rating = recurring friction point
Strong ratings in one group but weak ratings in another = segment-specific issue
Rising or falling scores over time = proof that changes are, or are not, working
On top of that, segment your ordinal scale questions by customer type, employee group, location, or product line. This makes one ordinal questionnaire example far more useful because it shows who needs what.
Then turn findings into action:
Fix recurring pain points
Improve high-importance, low-satisfaction areas
Refine messaging
Adjust product features
Train teams where performance ratings are weak
Here’s the thing: the best ordinal data example questions do not stop at ordered responses. They help you make informed decisions, which is where the real magic happens.
Related Question Design Surveys
29 Quantitative Survey Research Questions Examples
Explore 25 sample quantitative survey research questions and survey questions example to guide re...

28 Good Survey Questions
Discover 25 good survey questions to improve feedback quality, boost response rates, and inspire ...
29 Survey Questions Mistakes
Discover 25 survey questions mistakes with sample questions and expert tips to improve responses,...