29 Quantitative Survey Research Questions Examples
Explore 25 sample quantitative survey research questions and survey questions example to guide reliable survey design, analysis, and insights.
If you are hunting for an example of survey questions for research, you probably want more than theory. Quantitative survey research questions measure things with fixed-answer data, unlike open-ended qualitative prompts that invite longer opinions, because sometimes you need numbers, not a novel. Here’s the thing: you likely want both a clear framework and fast examples of quantitative questions you can adapt. In this guide, you’ll get examples of quantitative research questions, good quantitative survey questions, sample wording, when to use each type, and how to test quantitative research questions so your results actually say something useful.
Demographic Survey Questions
Sample questions
What is your age group?
What is the highest level of education you have completed?
Which region do you currently live in?
What is your current employment status?
What is your approximate monthly household income range?
Why & When to Use
Demographic questions turn raw responses into useful patterns.
If you need an example of survey questions for research that helps you compare groups, demographics are a smart place to start. These questions let you segment results by age, gender, income, education, role, location, household size, and other background traits.
Here’s the thing: demographic items matter most when you want audience profiling, subgroup comparisons, customer insights, academic studies, or examples of quantitative research questions in education. They also support cross-tab analysis, which is the fancy-but-helpful way to see how one group answers differently from another.
Use them when demographics connect directly to your research goal, not just because the survey builder gave you a tempting checkbox buffet. Asking irrelevant background questions can lower trust and completion rates.
In many examples of quantitative questions, demographic items appear near the end. Plus, that usually feels less intrusive unless you need them first for screening, such as confirming student status, job role, or region.
Keep your wording respectful and practical:
Use inclusive answer choices where possible.
Add “prefer not to say” for sensitive items when appropriate.
Choose clear ranges for age or income so responses are easy to analyze.
Match categories to your study objective and reporting plan.
On top of that, demographics pair nicely with how to test quantitative research questions, because they help you check whether trends hold across different groups instead of treating everyone like one giant spreadsheet blob.
Demographic questions enable reliable subgroup comparisons in surveys, but are most useful when directly tied to study objectives and analysis plans. Pew Research Center
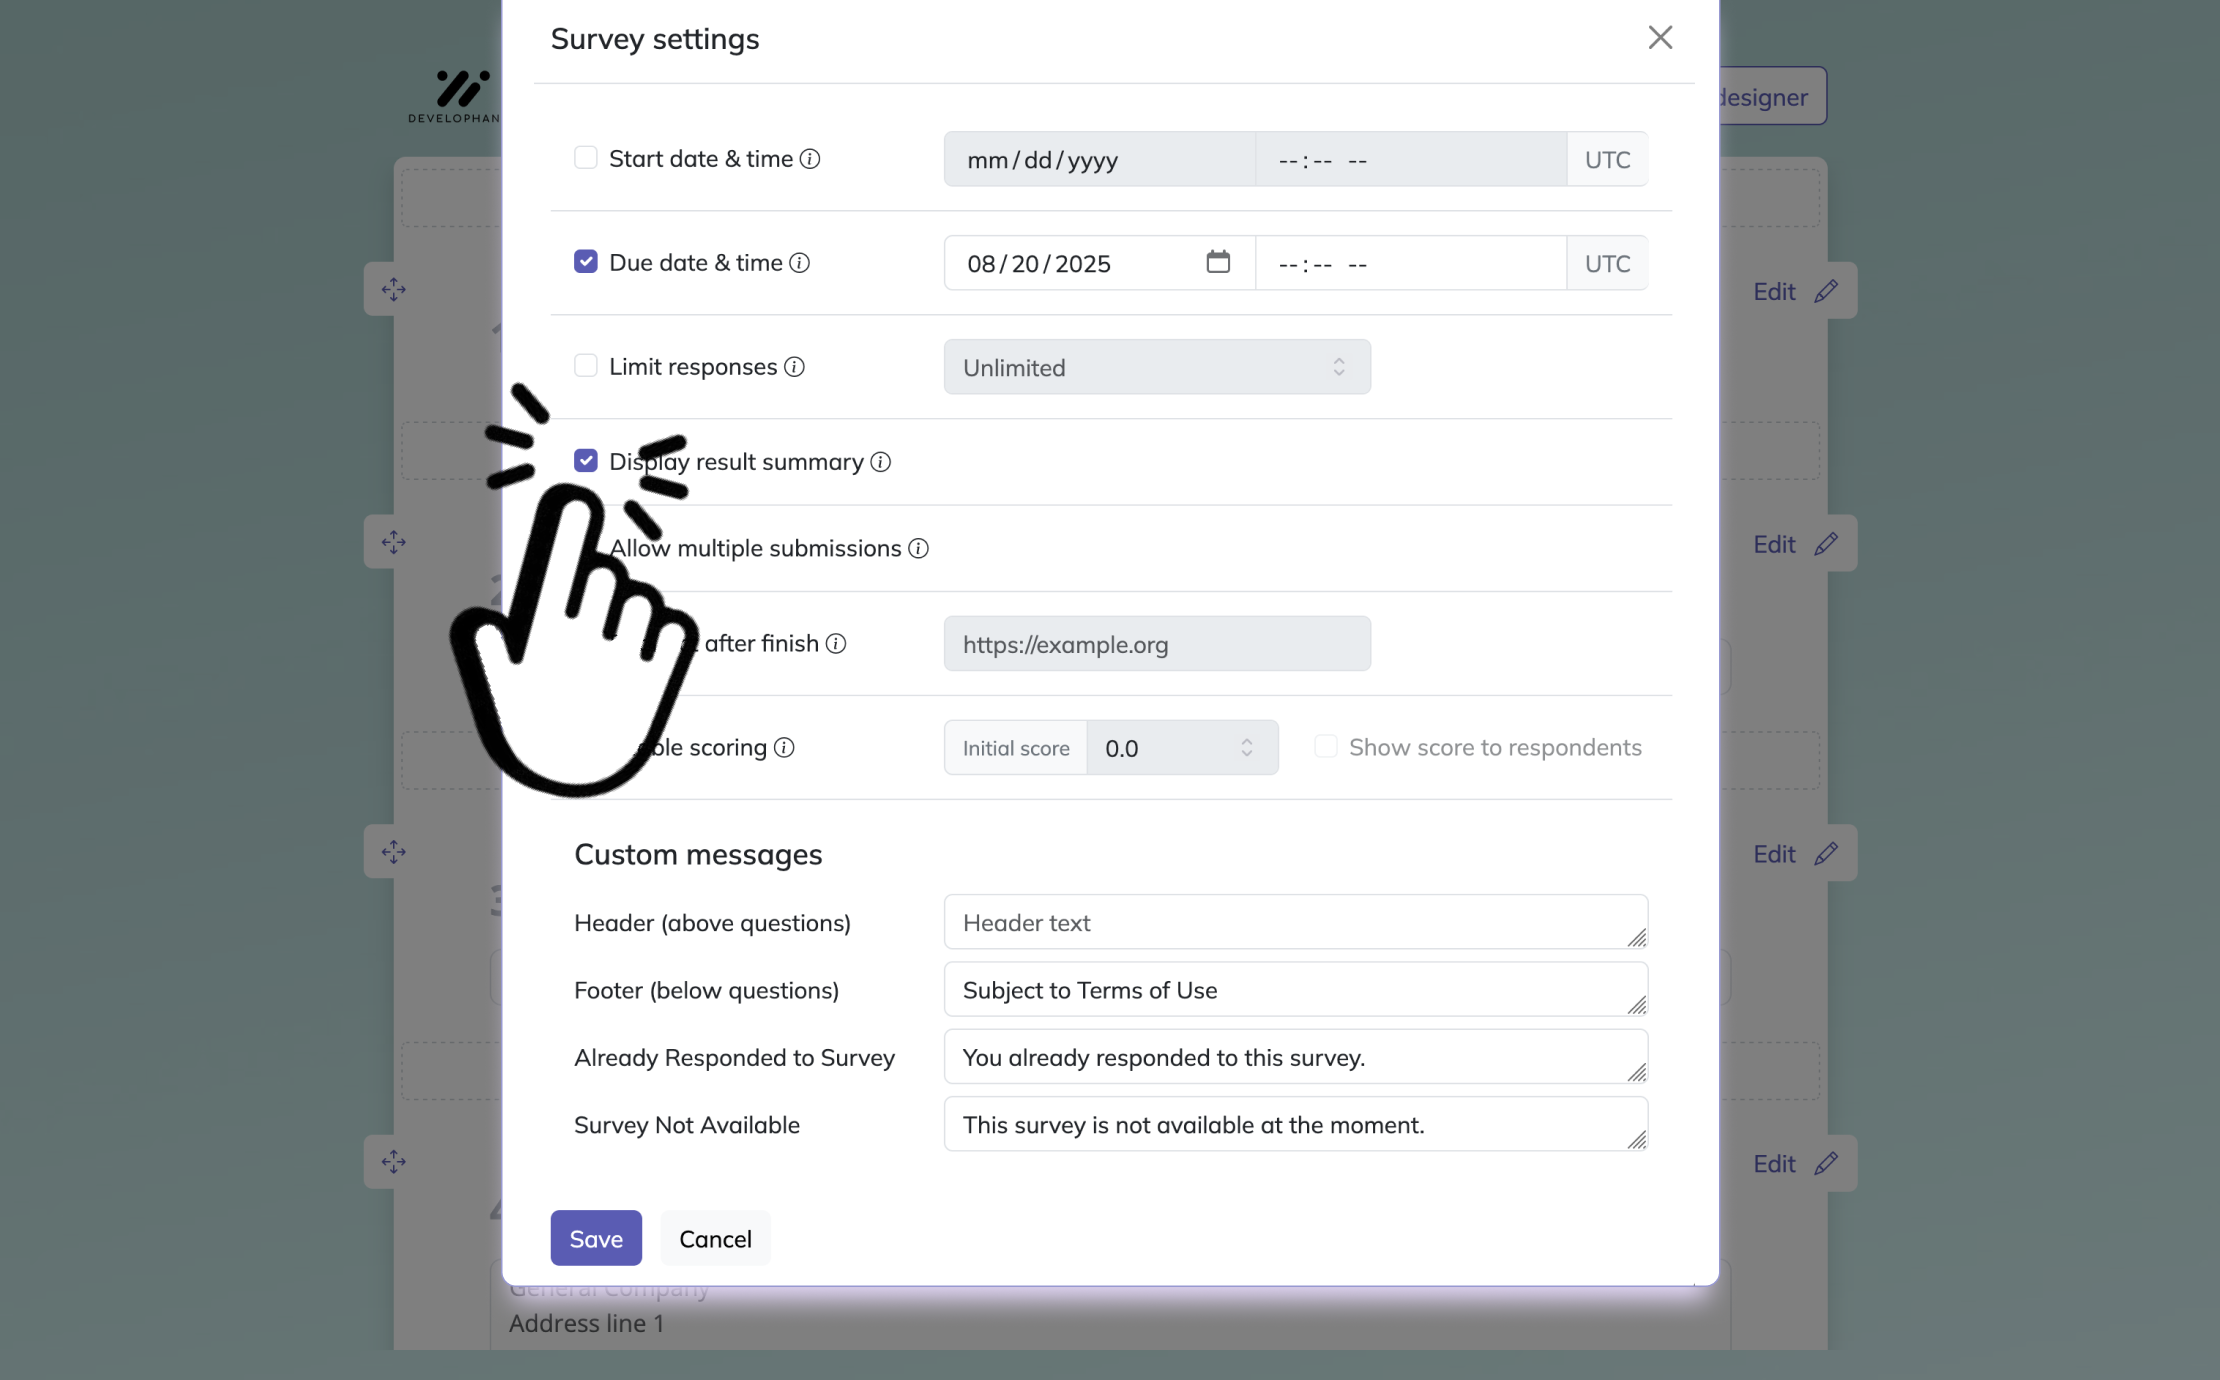
Here’s how to create a quantitative survey in HeySurvey:
1. Create a new survey
Start by opening a template with the button below, or begin from scratch. Give your survey a clear name in the editor. For quantitative research, use a simple structure that focuses on collecting measurable answers with an online survey tool.
2. Add questions
Click Add Question and choose question types that work well for quantitative survey research questions, such as Choice, Scale, Number, or Dropdown. Write short, specific questions with answer options that can be counted or compared. For example, use Likert scales for opinions and single-choice questions for categories. Mark important questions as required if needed.
3. Publish survey
Preview your survey to check the flow and wording, then click Publish to create a shareable link. Your survey is now ready to send to respondents and collect results.
Likert Scale Survey Questions
Sample questions
How strongly do you agree with the statement: “The product meets my expectations”?
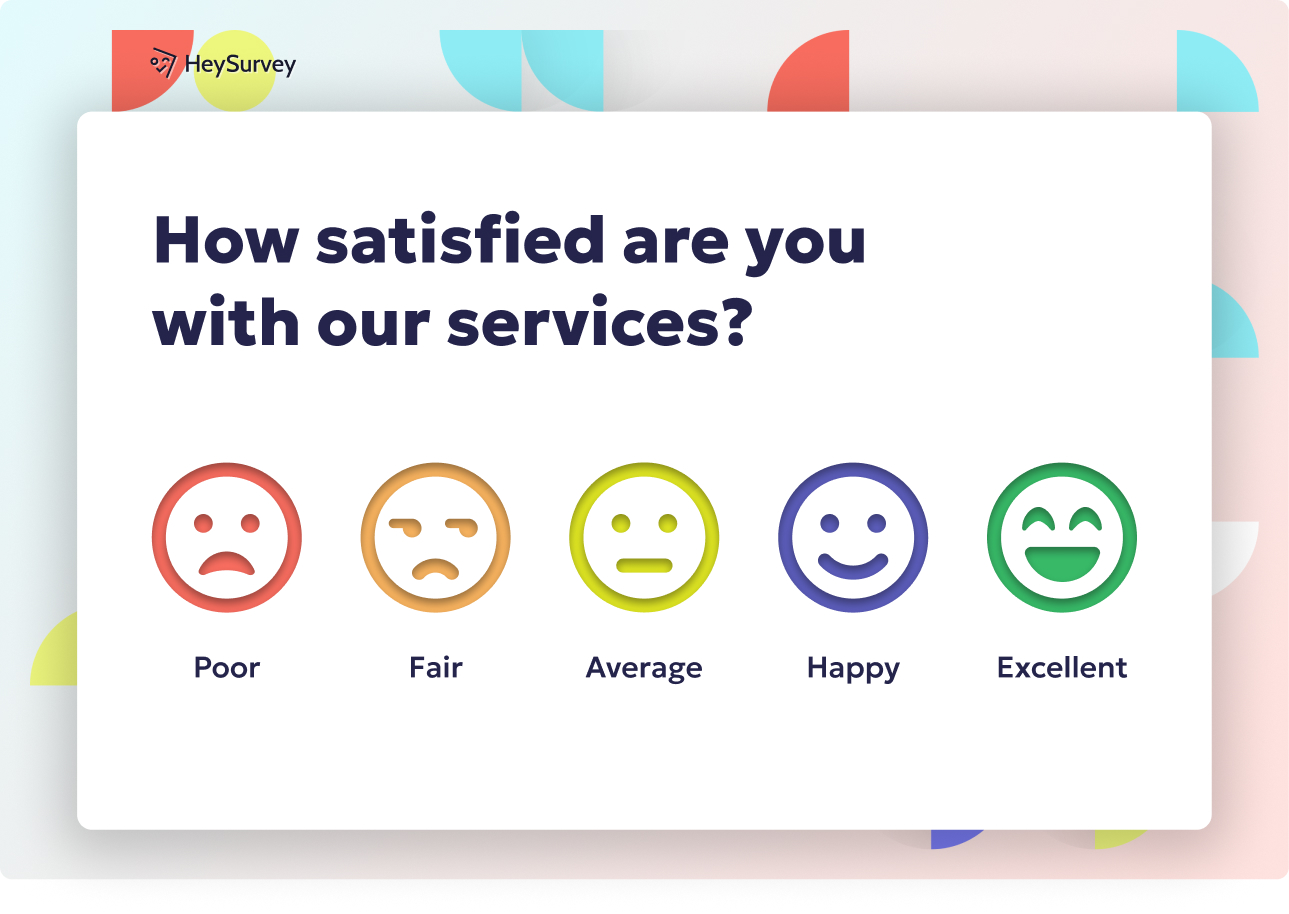
How satisfied are you with the quality of customer support you received?
How likely are you to recommend our service to others?
How easy was it to find the information you needed on our website?
How often do you feel motivated at work?
Why & When to Use
Likert scale questions make opinions measurable.
If you need an example of survey questions for research that turns feelings into data you can actually compare, Likert items are a go-to choice. They ask people to rate agreement, satisfaction, likelihood, ease, or frequency on a consistent numerical scale, which is why they show up so often in examples of quantitative questionnaires.
These are some of the strongest examples of quantitative questions because the answers are structured, easy to summarize, and simple to compare across groups. Here's the thing: when people ask how to test quantitative research questions, Likert items are often part of the answer because they work well for averages, trends, and side-by-side analysis.
They are especially useful for:
customer satisfaction surveys
employee engagement studies
academic research
brand perception tracking
service evaluation
For cleaner results, stick with one scale format across the survey, usually 5-point or 7-point. On top of that, use balanced labels on both ends and decide carefully whether a neutral midpoint belongs there, because sometimes “neutral” is honest, and sometimes it is just the couch potato of responses.
If you want good survey questions for quantitative research that can be statistically compared, Likert scales are a smart pick. They also pair well with qualitative and quantitative questions examples when you want numbers first and explanations second.
Research suggests Likert scales with about 5–7 response categories generally provide better reliability and discrimination than shorter scales (source).
Multiple-Choice Survey Questions
Sample questions
Which of the following best describes your primary reason for purchasing this product?
Where did you first hear about our brand?
Which device do you use most often to access online content?
What is your preferred method of receiving customer support?
Which subject area do you find most challenging in school?
Why & When to Use
Multiple-choice questions keep answers tidy and analysis friendly.
If you need an example of survey questions for research that is easy to answer and easy to analyze, multiple-choice questions are a strong fit. They give people predefined options, which makes them especially useful for behavior, preferences, awareness, and factual information.
These are some of the most practical examples of quantitative questions because they reduce ambiguity and make response patterns easier to spot. Plus, if you are learning how to test quantitative research questions, this format helps because the data is already grouped into neat little buckets, which is basically a gift to your spreadsheet.
Use single-select questions when only one answer should be true.
primary purchase reason
first source of brand awareness
most-used device
Use multi-select questions when respondents may reasonably choose more than one option.
marketing channels seen
support methods used
study resources relied on
For strong examples of quantitative research questions, make single-select options mutually exclusive so respondents are not stuck choosing between two almost-identical answers. On top of that, include “Other” only when there is a real chance your list misses something important, and avoid huge answer lists that make people scroll like they are hunting for treasure.

Ranking Survey Questions
Sample questions
Rank the following product features from most important to least important.
Rank these factors based on what most influences your purchase decisions.
Rank the following school resources by usefulness to your learning experience.
Rank these service improvements in the order you would like to see them implemented.
Rank the following benefits by how valuable they are to you as an employee.
Why & When to Use
Ranking questions reveal what wins when people have to choose.
If you need an example of survey questions for research that shows priority, not just opinion, ranking questions are a smart pick. They ask people to place options in order based on importance, preference, or impact, which helps you see what rises to the top when trade-offs are unavoidable.
Here’s the thing: ranking is different from rating. In rating, a person can score several items highly, but in ranking, each item must earn a different position, which makes these some of the most useful examples of quantitative questions when you want to compare competing options.
Use ranking when your goal is to understand priorities in areas like:
feature prioritization
brand comparisons
curriculum preferences
purchase decision drivers
employee benefit preferences
Plus, ranking works best when the list is short and the sorting rule is crystal clear. If you give people too many items to rank, their answers get messy fast, and nobody wants a survey that feels like sorting socks in the dark.
For cleaner examples of quantitative research questions, keep the criteria specific, such as most useful or least important. On top of that, if you are learning how to test quantitative research questions, ranking is especially helpful when you want to identify trade-offs rather than measure independent opinions.
Ranking survey questions yield quantitative trade-off data, but best practice is limiting options to 6–10 because middle ranks are often noisy and less reliable (Qualtrics)
Frequency and Behavior-Based Survey Questions
Sample questions
How often do you purchase groceries online?
In the past 30 days, how many times have you visited our store?
How many hours per week do you spend studying outside class?
How frequently do you use mobile banking services?
How often do you exercise for at least 30 minutes?
Why & When to Use
Behavior-based questions turn actions into numbers you can actually use.
If you want an example of survey questions for research that produces clear, measurable answers, frequency and behavior-based questions are a great choice. They ask what people do, how often they do it, and how recently they did it, which makes them strong examples of quantitative questions for real-world analysis.
Here’s the thing: people are often better at reporting actions than vague feelings. Asking "How many times did you visit in the last 30 days?" usually gives you cleaner data than asking whether someone "likes" your store a lot, which is a little squishier.
These questions work especially well for:
usage tracking
health research
consumer habits
digital behavior
education attendance and study habits
Plus, they are easier to compare over time when you use precise time frames like daily, weekly, monthly, or within the last 30 days. That precision matters if you are learning how to test quantitative research questions, because countable behavior is much easier to analyze, track, and verify.
On top of that, these are some of the best examples of quantitative research questions when you want trend analysis or forecasting. If behavior keeps repeating on a pattern, your data starts telling a story, and unlike your group chat, it usually stays on topic.
Matrix Survey Questions
Sample questions
Please rate your satisfaction with the following aspects of our service: speed, accuracy, professionalism, and communication.
Please indicate your agreement with the following statements about your workplace: management is supportive, goals are clear, communication is effective, and growth opportunities are available.
Please rate the importance of the following product attributes: price, durability, design, and ease of use.
Please evaluate the following parts of your educational experience: course materials, teaching quality, feedback speed, and classroom environment.
Please rate how easy the following tasks are in our app: signing in, finding features, completing a purchase, and contacting support.
Why & When to Use
Matrix questions help you measure several related ideas fast without repeating the same response scale over and over.
If you need an example of survey questions for research that covers multiple statements efficiently, matrix survey questions are a smart pick. They group related items under one shared scale, which makes them practical examples of quantitative questions in longer research questionnaires.
Here’s the thing: they work best when the items belong together and can be judged in the same way. That is why they show up so often in service quality studies, employee feedback forms, course evaluations, and product comparisons.
They are especially useful for:
service quality dimensions
employee experience surveys
course and teaching evaluations
product attribute comparisons
examples of quantitative questionnaires with repeated rating scales
Plus, good matrix design starts with wording, not fancy boxes. Keep each statement short, parallel, and easy to scan so respondents do not feel like they are decoding a tax form.
On top of that, do not overuse them. If your matrix gets too long, people may click the same answer all the way down, which is speedy but not exactly insightful.
If you are learning how to test quantitative research questions, this matters a lot. Sometimes separate Likert items are better than one long matrix, especially when topics are complex or need extra attention.

How to Test Quantitative Research Questions Before Launch
Sample questions
Is the wording of this question clear and easy to understand?
Do any answer choices feel missing or overlapping?
How would you interpret the phrase “regular use” in this question?
Were there any questions you found difficult to answer accurately?
How long did it take you to complete this survey section?
Why & When to Use
Test first, regret less.
If you are figuring out how to test quantitative research questions, the goal is simple: make sure your survey collects clean, measurable data before real respondents ever see it. A quick test can reveal whether your example of survey questions for research is clear, valid, consistent, and actually tied to your research objective.
Here’s the thing: even strong-looking examples of quantitative questions can flop if people read them differently than you intended. One tiny vague phrase can turn useful data into a statistical mystery, and nobody wants their spreadsheet acting like a drama queen.
Before launch, run a pilot test with a small sample that resembles your real audience. This works well for academic studies, customer surveys, employee research, and other example research questions for quantitative research where data quality really matters.
Check for issues like:
double-barreled questions that ask two things at once
leading wording that nudges people toward one answer
vague or overlapping answer choices
response options that do not match the question type
timing, comprehension, and consistency across respondents
Plus, review whether the answers produce measurable results you can actually analyze. On top of that, if people hesitate, misread terms, or finish suspiciously fast, your question likely needs a tune-up before full launch.
Best Practices for Writing Good Quantitative Survey Questions
Sample questions
Does each survey question clearly connect to one research goal or hypothesis?
Are the answer choices complete, specific, and easy to measure?
Is the wording neutral enough that it does not push people toward one response?
Are the scales consistent across similar questions in this section?
Would this question still make sense to someone outside your field or team?
Why & When to Use
Write for data, not confusion.
When you create an example of survey questions for research, every item should earn its place. The best examples of quantitative questions are clear, measurable, and directly tied to what you want to test.
Here’s the thing: good survey writing is less about sounding smart and more about making answers easy to analyze. If respondents need a decoder ring, the question needs work.
Follow these dos:
Tie every question to a specific objective or hypothesis.
Use simple, neutral, unambiguous wording.
Keep scales consistent across similar questions.
Define time frames, units, and key terms clearly.
Make answer options exhaustive and non-overlapping.
Use practical examples when showing an example of questionnaire in quantitative research.
Match wording to your audience, whether you need examples of quantitative research questions in education, business, healthcare, or customer experience.
Avoid these don’ts:
Do not ask double-barreled questions.
Do not use leading or loaded wording.
Do not switch scales without a reason.
Do not ask sensitive demographics unless needed.
Do not overload the survey with matrix or ranking items.
Do not confuse qualitative and quantitative questions examples, because quantitative items need structured, measurable responses.
Do not ignore pilot feedback before launch.
Plus, strong example research questions for quantitative research feel simple on the surface, which is exactly the magic trick.
Turning Survey Insights Into Action
Sample questions
Which findings show the strongest trends or statistically meaningful differences?
Which respondent segments report the highest or lowest satisfaction?
What behaviors are most strongly associated with positive outcomes?
Which low-scoring areas should be addressed first based on business or research goals?
What follow-up quantitative or qualitative research is needed next?
Why & When to Use
Turn numbers into next steps.
Collecting responses is only helpful if the findings actually lead somewhere. The real value in an example of survey questions for research shows up when your data helps you make decisions, improve experiences, or shape the next round of research.
Here’s the thing: this is the bridge between writing strong examples of quantitative questions and getting real-world results. A tidy spreadsheet is nice, but action is the part that pays rent.
Start by organizing results in ways that match your goal:
Group findings by theme, objective, or survey section.
Compare responses across demographics, behaviors, or satisfaction levels.
Look for patterns in high-performing and low-performing segments.
Flag trends that appear often and matter most to your research or business goals.
Use response quality to improve future examples of quantitative questionnaires.
Note gaps where new examples of quantitative research questions or follow-up interviews may be needed.
Plus, if one issue appears frequently but has low impact, it may not deserve top billing just yet. On top of that, a smaller issue with a big effect might be your golden ticket.
When you how to test quantitative research questions, your job is not just to report what happened. It is to decide what to fix, what to explore next, and how to write better example research questions for quantitative research next time.
Related Question Design Surveys

28 Good Survey Questions
Discover 25 good survey questions to improve feedback quality, boost response rates, and inspire ...
29 Survey Questions Mistakes
Discover 25 survey questions mistakes with sample questions and expert tips to improve responses,...
31 Fun Survey Questions Ideas
Explore 25 fun survey questions ideas with sample questions to inspire engaging, creative surveys...