
Table of Contents
What is a likert scale?
A likert-type scale survey questionnaire is a type of question that helps find out how people feel about a certain topic or issue. The term refers to Rensis Likert, the American social scientist who created it.
The responses are usually based on a scale from strongly agree to strongly disagree, and can also include neutral options in the middle.
This type of questionnaire is often used to evaluate customer satisfaction, event feedback, employee engagement and market research surveys.
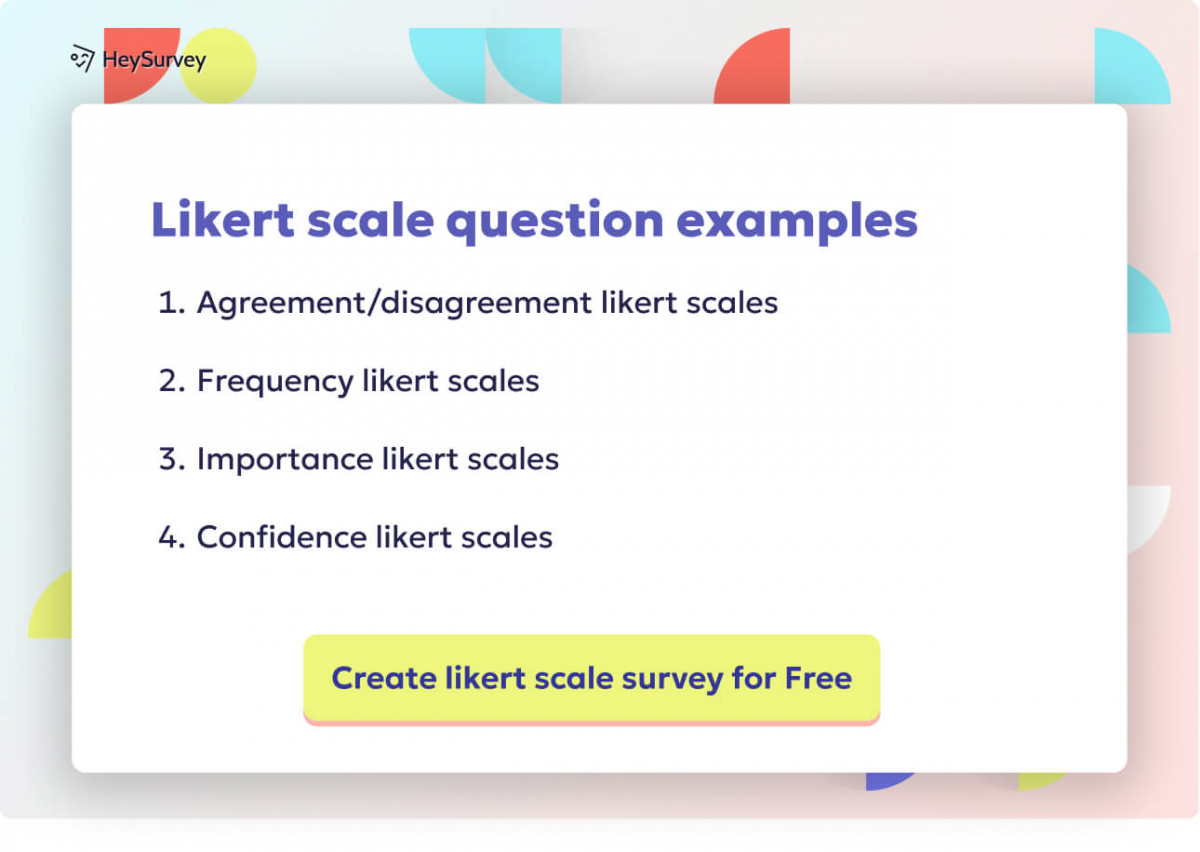
Likert scale question examples
Examples of different types of Likert scales include:
- Agreement/disagreement likert scales: this type of scale measures whether respondents agree or disagree with a particular statement. For example, “I am satisfied with the service I received from this company.”
- Frequency likert scales: this type of scale asks how frequently a respondent does something. For example, “How often do you use this product?”
- Importance likert scales: this type of scale measures how important respondents find a particular statement or aspect to be. For example, “How important is customer service to you when selecting a company to do business with?”
- Confidence likert scales: this type of scale measures the confidence levels of respondents in their responses. For example, “How confident are you that your answer is correct?”
ROSS'S PRO TIP
Try using HeySurvey to conduct likert scale surveys. It is 100% free with likert scale templates included.
Customer satisfaction examples
Ease of Use: How would you rate the ease of use of our product/service?
- 1: Extremely difficult
- 2: Very difficult
- 3: Neither easy nor difficult
- 4: Very easy
- 5: Extremely easy
Quality: How satisfied are you with the overall quality of our product/service?
- 1: Extremely dissatisfied
- 2: Very dissatisfied
- 3: Somewhat dissatisfied
- 4: Neither satisfied nor dissatisfied
- 5: Somewhat satisfied
- 6: Very satisfied
- 7: Extremely satisfied
Customer Support: How would you rate the responsiveness and effectiveness of our customer support team?
- 1: Extremely poor
- 2: Very poor
- 3: Neither good nor poor
- 4: Very good
- 5: Excellent
Value for Money: To what extent do you believe our product/service provides value for your money?
- 1: Not at all valuable
- 2: Slightly valuable
- 3: Moderately valuable
- 4: Neutral
- 5: Fairly valuable
- 6: Highly valuable
- 7: Exceptionally valuable
Meeting Expectations: How well did our product/service meet your expectations?
- 1: Far below expectations
- 2: Below expectations
- 3: Slightly below expectations
- 4: Met expectations
- 5: Slightly exceeded expectations
- 6: Exceeded expectations
- 7: Far exceeded expectations
Likelihood to Recommend: How likely are you to recommend our product/service to a friend or colleague?
- 1: Extremely unlikely
- 2: Very unlikely
- 3: Somewhat unlikely
- 4: Neither likely nor unlikely
- 5: Somewhat likely
- 6: Very likely
- 7: Extremely likely
Event feedback examples
Overall Satisfaction: Overall, how satisfied were you with [event name]?
- 1: Extremely dissatisfied
- 2: Very dissatisfied
- 3: Somewhat dissatisfied
- 4: Neither satisfied nor dissatisfied
- 5: Somewhat satisfied
- 6: Very satisfied
- 7: Extremely satisfied
Engagement: How engaging did you find [event name]?
- 1: Not at all engaging
- 2: Slightly engaging
- 3: Moderately engaging
- 4: Neutral
- 5: Fairly engaging
- 6: Highly engaging
- 7: Exceptionally engaging
Informative: How informative was [event name]?
- 1: Not at all informative
- 2: Moderately informative
- 3: Neutral
- 4: Highly informative
- 5: Exceptionally informative
Clarity of Goals: Were the event’s goals clear to you?
- 1: Extremely unclear
- 2: Very unclear
- 3: Somewhat unclear
- 4: Neither clear nor unclear
- 5: Somewhat clear
- 6: Very clear
- 7: Crystal clear
Organization and Navigation: How well-organized and easy to navigate was [event name]?
- 1: Very disorganized and difficult to navigate
- 2: Somewhat disorganized and difficult to navigate
- 3: Neither organized nor disorganized, neither easy nor difficult to navigate
- 4: Somewhat organized and easy to navigate
- 5: Very organized and easy to navigate
Likelihood to Recommend: How likely would you be to recommend [event name] to a friend or colleague?
- 1: Extremely unlikely
- 2: Very unlikely
- 3: Somewhat unlikely
- 4: Neither likely nor unlikely
- 5: Somewhat likely
- 6: Very likely
- 7: Extremely likely
Employee engagement examples
Pride in Team Membership: I am proud to be part of the team.
- 1: Strongly disagree
- 2: Disagree
- 3: Somewhat disagree
- 4: Neither agree nor disagree
- 5: Somewhat agree
- 6: Agree
- 7: Strongly agree
Meaningful Work: I feel that my work is meaningful and contributes to the overall success of the company.
- 1: Strongly disagree
- 2: Disagree
- 3: Somewhat disagree
- 4: Neither agree nor disagree
- 5: Somewhat agree
- 6: Agree
- 7: Strongly agree
Supervisor Support: I feel that my supervisor/manager provides me with the support and guidance I need to perform my job well.
- 1: Strongly disagree
- 2: Disagree
- 3: Somewhat disagree
- 4: Neither agree nor disagree
- 5: Somewhat agree
- 6: Agree
- 7: Strongly agree
Coworker Appreciation: I feel that my coworkers value my contributions and respect me as a team member.
- 1: Strongly disagree
- 2: Disagree
- 3: Neither agree nor disagree
- 4: Agree
- 5: Strongly agree
Growth and Development Opportunities: I am satisfied with the opportunities for growth and development within the [company department].
- 1: Strongly disagree
- 2: Disagree
- 3: Somewhat disagree
- 4: Neither agree nor disagree
- 5: Somewhat agree
- 6: Agree
- 7: Strongly agree
Likert scale Advantages
1. Flexibility: The Likert scale allows survey writers to craft questions with different levels of intensity, giving the respondent more ability to provide detailed and accurate feedback in their responses. This also makes it easier for the researcher to compare results from multiple surveys as they can be standardized across respondents.
2. Quantified data: Rather than relying on subjective opinions which may not be easily interpreted, Likert scales offer a quantifiable way of recording survey answers and making them easier to analyze through statistical methods such as mean or median calculations.
3. Efficient collection: Surveys using the Likert scale are usually short enough that large groups of people can answer them quickly without becoming tired or bored by lengthy surveys that take up too much time. This makes it an ideal method for collecting data in situations where there is limited time available but still a need for detailed and quantitative information about customer opinions or preferences.
4. Rich feedback: Instead of providing only binary ‘yes/no’ answers, respondents using a Likert scale have different degrees of intensity when expressing their opinion on survey topics – thus offering richer insights into consumer behavior and attitudes than other types of surveys could provide alone.

Likert scale Disadvantages
1. The Likert scale can be subject to bias as respondents may not always give an honest answer due to social desirability or other pressures.
2. It also relies on self-assessment, so the results are only as reliable as the individual's ability and willingness to accurately reflect their feelings and opinions.
3. Last disadvantage is that it doesn’t use a closed question format, so there is less opportunity for automated analysis of survey data, which can lead to errors in data interpretation.
Tips to Improve Results with Likert Scale Surveys
1. Use a balanced set of questions and responses that provide equal representation of both positive and negative feedback.
2. Provide clear instructions for how to complete the survey, including what each answer signifies.
3. Make sure the scale is appropriate for the type of question that it is asking. For example, a 7-point scale should be used when measuring customer satisfaction but may not be suitable for measuring opinions about political views or beliefs.
4. Avoid leading questions that are overly suggestive of one answer over another - this can lead respondents to give answers they think you want rather than their true opinion.
5. Keep your questions concise and to the point. This will help to ensure that respondents are not overwhelmed by the survey or too confused by long or complex sentences.
6. Make sure all responses are anonymous and confidential in order to avoid bias.
7. Offer a comment box at the end to give respondents a chance to provide more detailed feedback if they wish.
8. Analyze the results carefully with your team to get the most accurate insights out of the survey data.
In a nutshell
In conclusion, the Likert scale is an effective method of measuring customer satisfaction and attitudes. It is a relatively simple way to collect data from customers in order to gain insights about their experiences with a product or service. By creating questions that are relevant and meaningful, providing adequate context for each question, and following best practices when constructing surveys, you will be able to use the Likert scale to its full potential. Doing so can help you better understand your target audience’s needs and preferences in order to create a more satisfying experience for them.
Would you like to create and conduct a Likert scale survey? HeySurvey offers all the necessary tools for the survey creation and implementation!