29 Survey Questions with Numerical Answers
Explore 25 survey questions with numerical answers, offering practical examples for research, feedback, and data collection across many topics.
Survey questions with numerical answers help you collect clear, measurable data without turning analysis into a wild spreadsheet safari.
survey questions with numerical answers
You can use them for customer feedback, employee research, education, healthcare, market research, and survey questions for statistics project work. Plus, this guide walks you through numerical survey questions, numerical data questions, range-of response questions examples, examples of numerical statistical questions, and even practical inspiration tied to survey questions for statistics project, 100 survey questions and answers, and survey questions with answers.
Rating Scale Questions
Sample questions
On a scale of 1 to 10, how satisfied are you with our service?
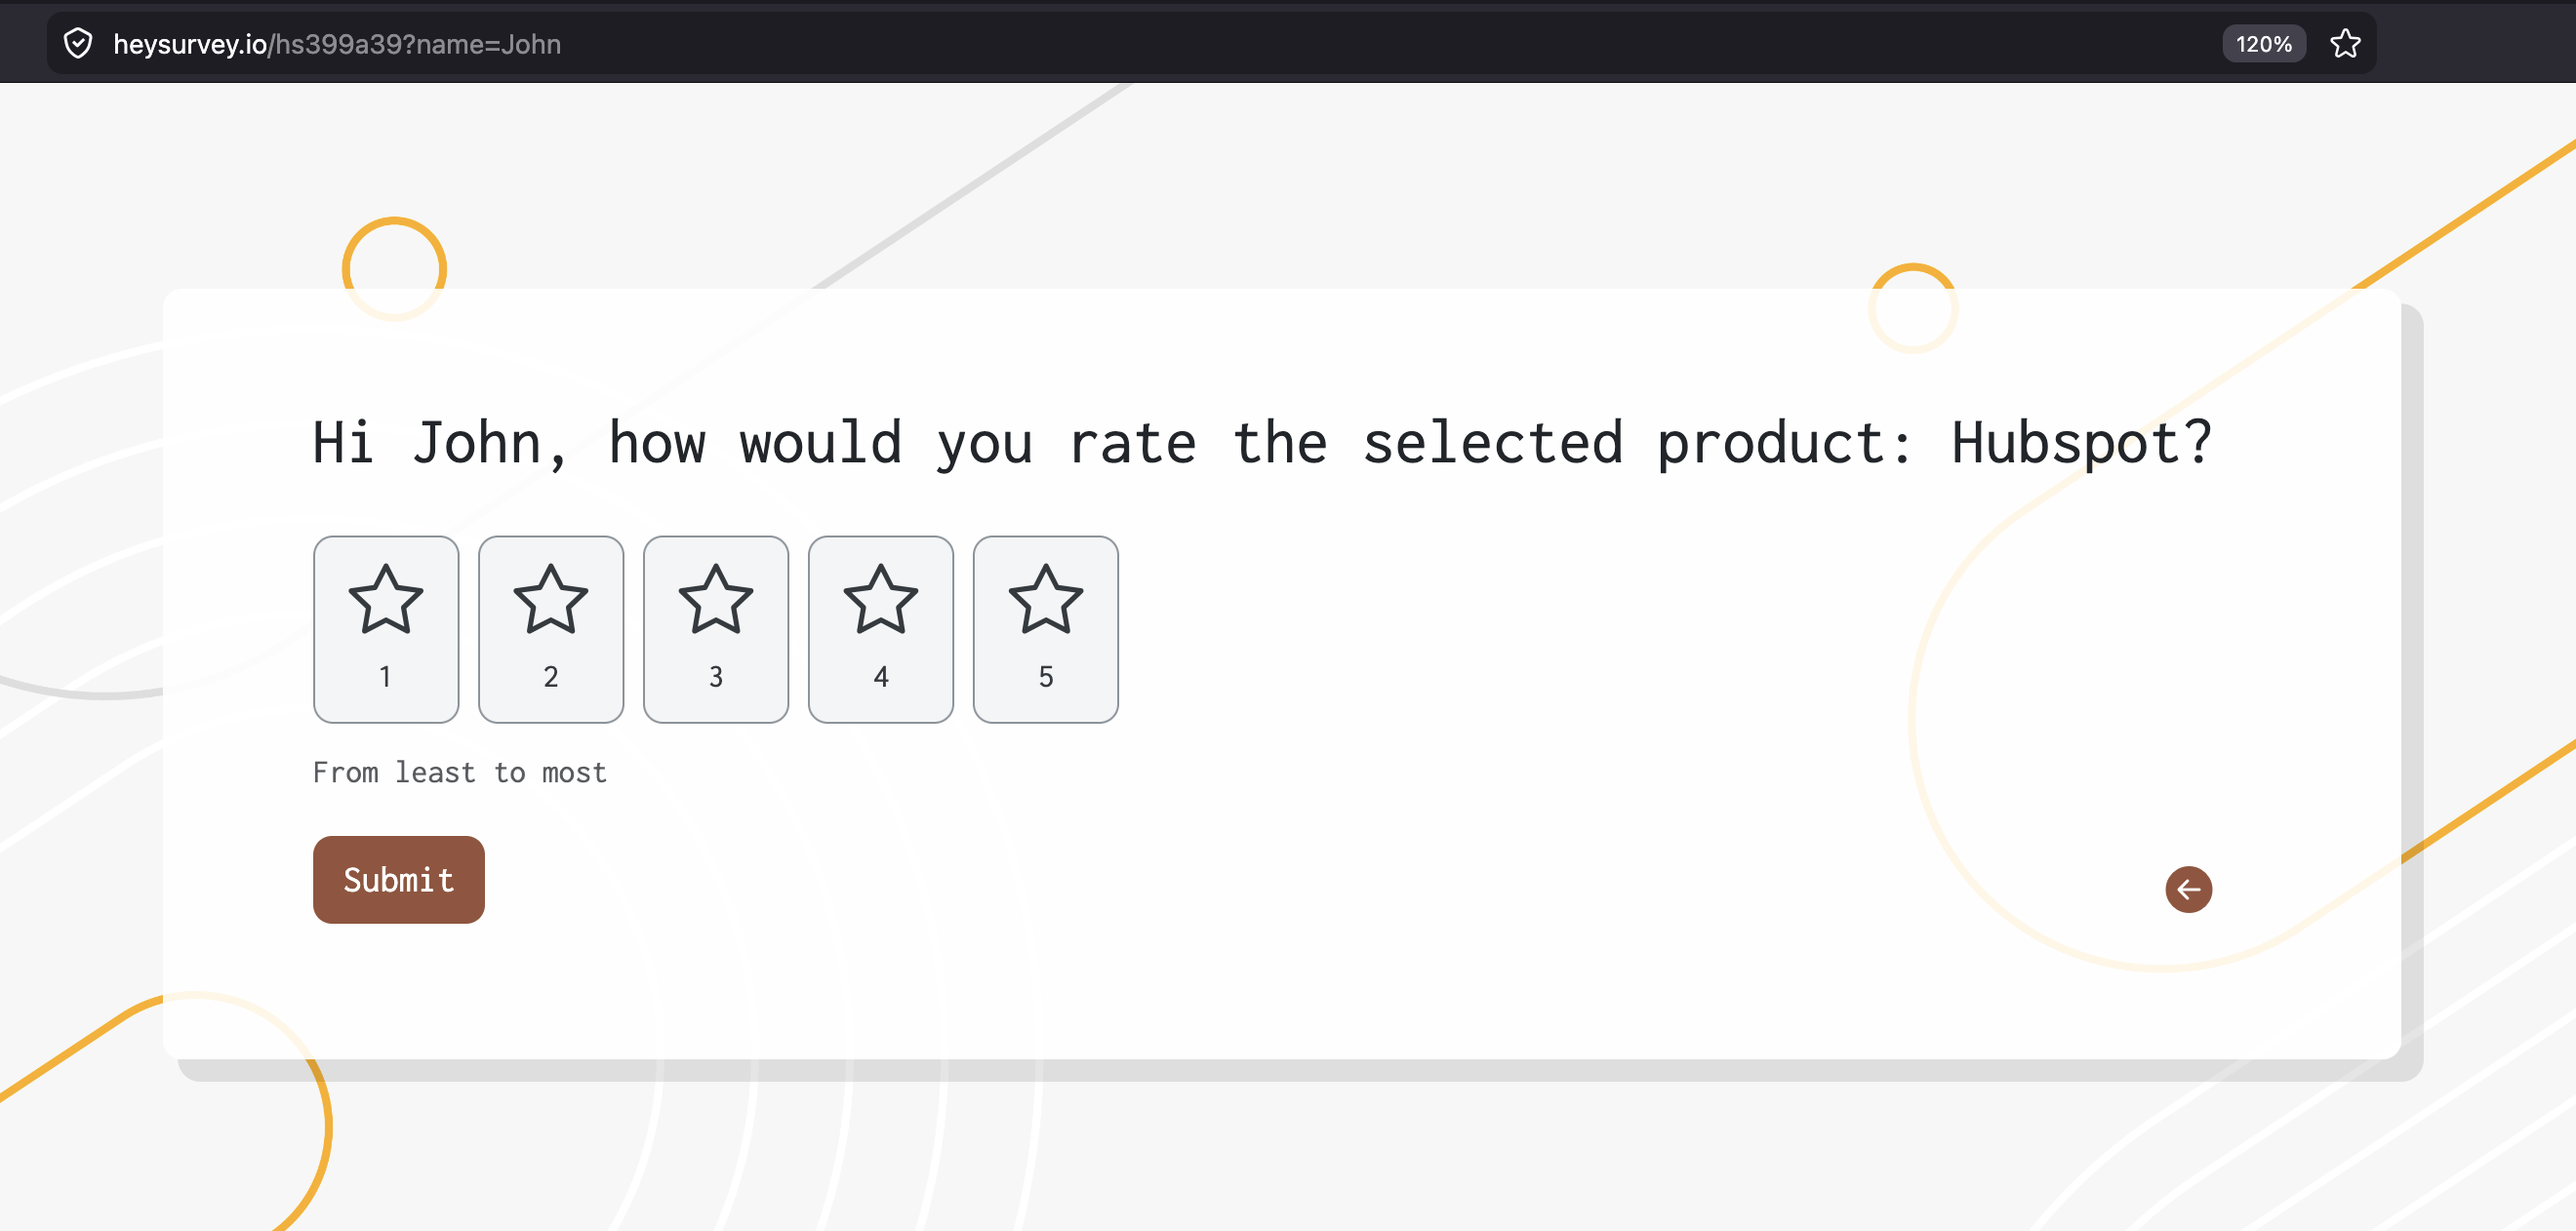
How would you rate the quality of the product on a scale of 1 to 5?
On a scale of 0 to 10, how likely are you to recommend us to a friend?
How easy was it to complete your purchase on a scale of 1 to 7?
How would you rate your overall experience with our support team on a scale of 1 to 10?
structured data you can actually use
Why & When to Use
Rating scale questions ask people to pick a number from a fixed range, like 1 to 5, 1 to 7, or 1 to 10.
They are perfect when you want fast, clean feedback on satisfaction, quality, likelihood to recommend, ease of use, or overall experience.
This is one of the most common forms of survey questions with numerical answers because the results are easy to compare, chart, and summarize without needing a detective board and red string.
Here’s the thing, unlike open-ended comments, rating scales give you structured responses that work beautifully in reports, spreadsheets, and survey questions for statistics project assignments.
They also fit naturally into range-of response questions examples, since each answer falls within a defined numerical span that makes trends easier to spot.
To make your data stronger, keep your scale design consistent across similar questions.
Use the same range when measuring similar topics, such as satisfaction across several services.
Label the endpoints clearly, like 1 = very dissatisfied and 10 = very satisfied.
Choose a scale length that matches the level of detail you want.
Avoid switching scale formats too often, because that can muddy your data survey questions.
Plus, if you are building survey questions for statistics project work or even collecting ideas for 100 survey questions and answers, strong scale design helps your results stay useful and trustworthy.
Research suggests rating scales with about 5–7 response categories generally optimize reliability and validity for numerical survey questions (source).

Create a survey with numerical answer questions in HeySurvey in 3 easy steps
Create a new survey
Start by opening a template below or choose an empty sheet to build from scratch. HeySurvey will open the survey editor, where you can name your survey and adjust basic settings. If you want, you can also use a pre-built template to save time with our online survey tool.Add questions
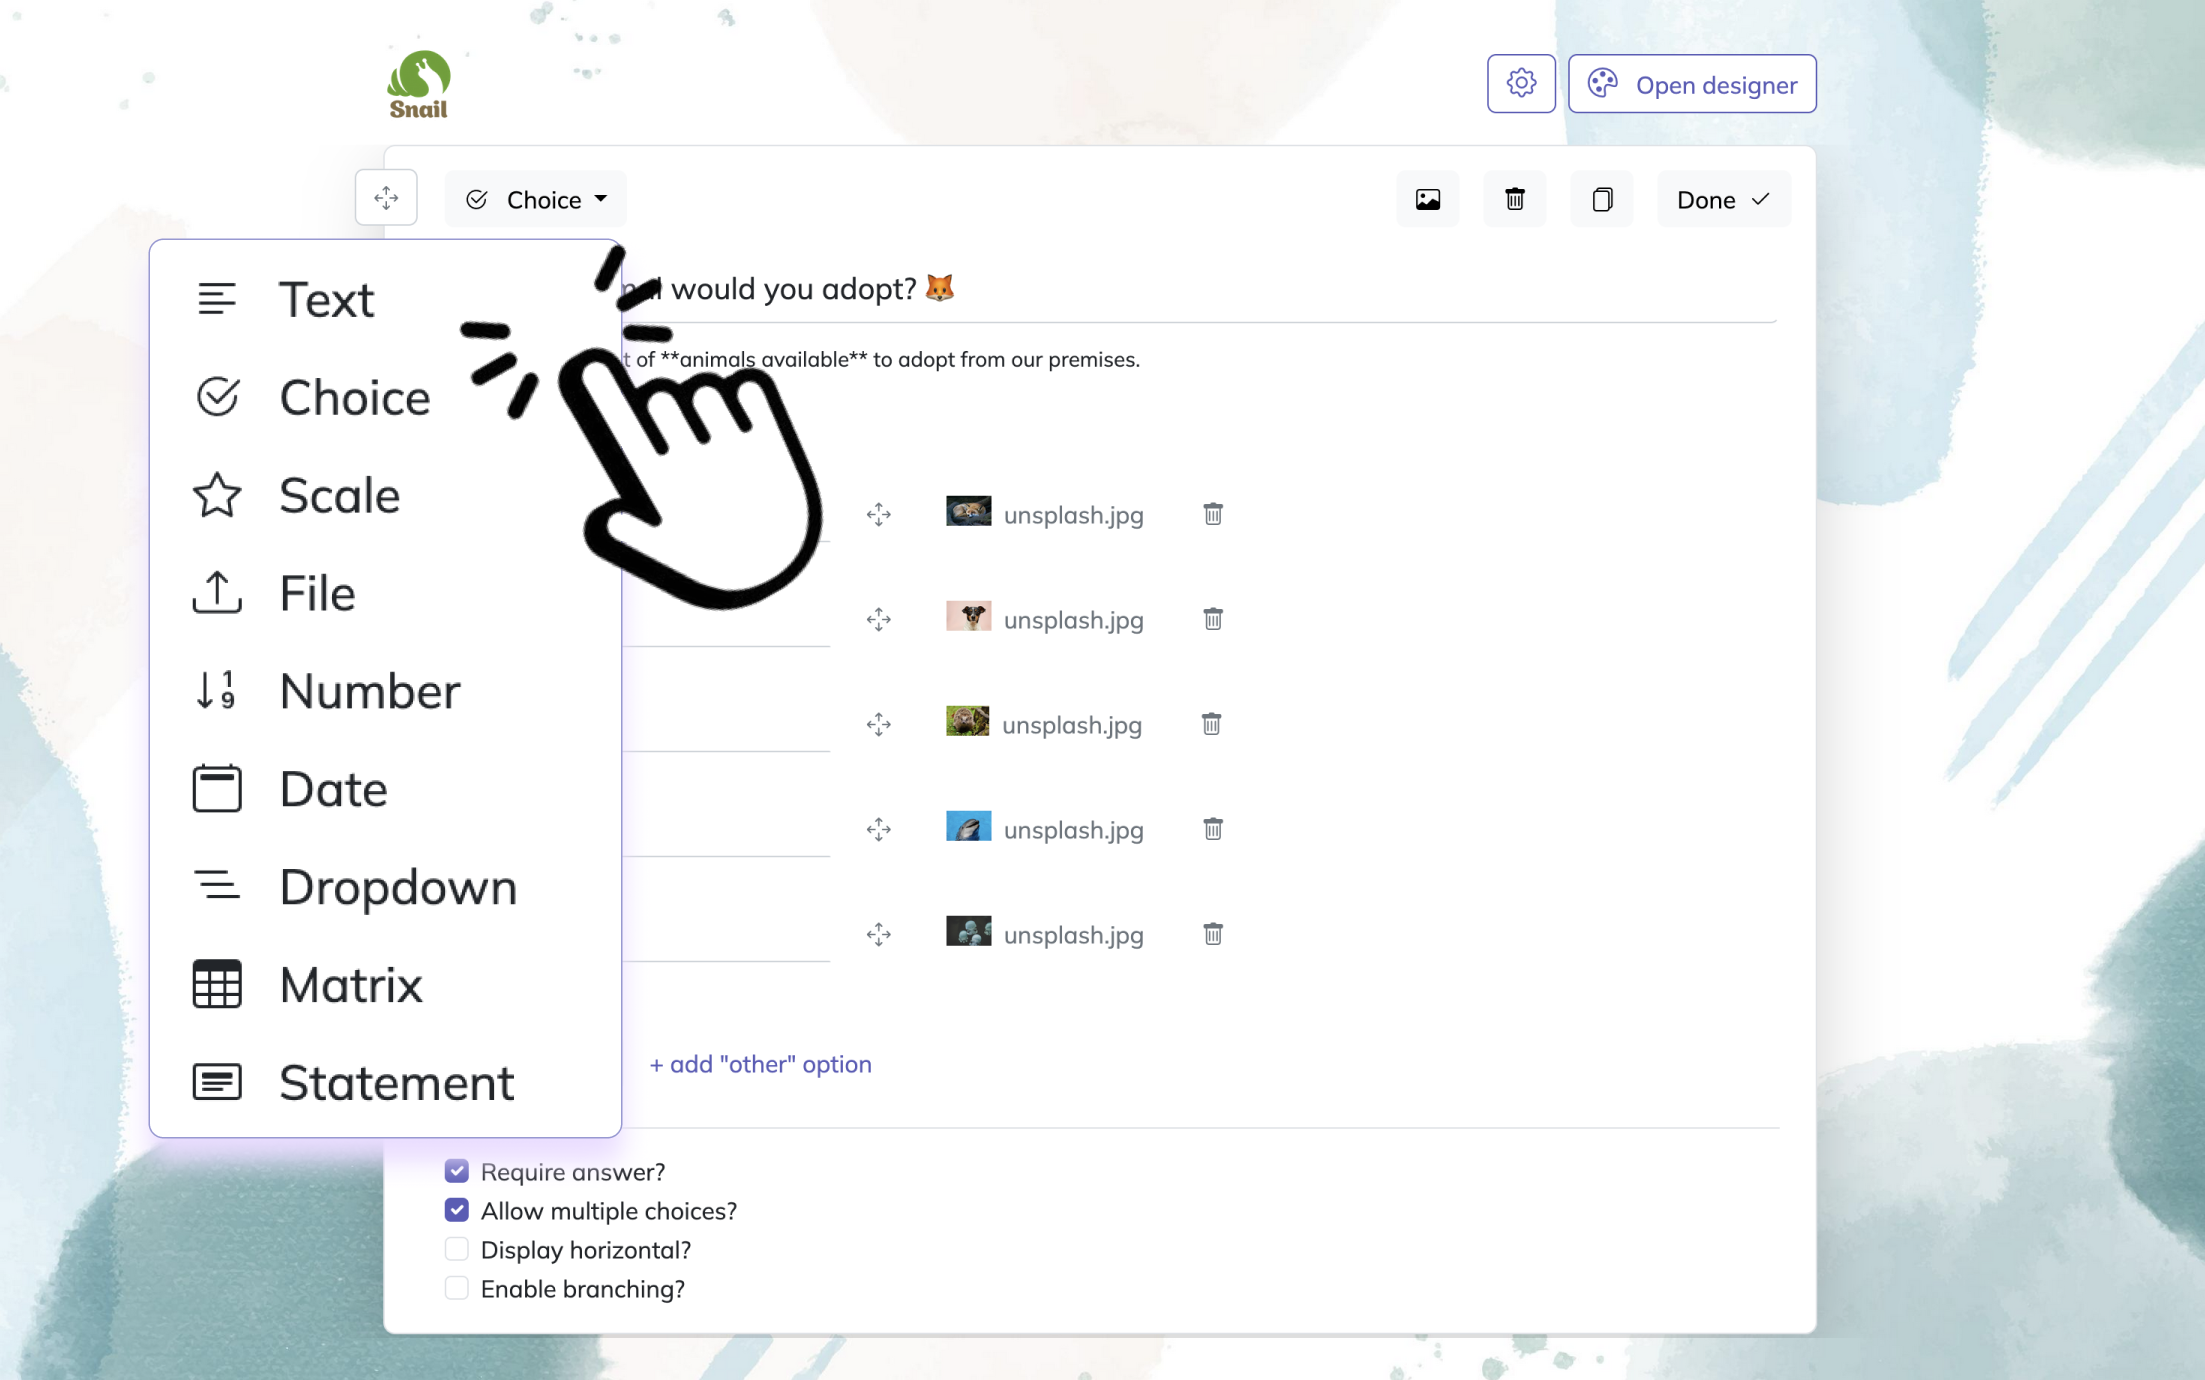
Click Add Question and select Number for questions that need numeric answers, such as age, budget, quantity, or a score. Type your question text, add a description if needed, and set options like required, min/max values, and decimal support to control the answers respondents can enter.Publish survey
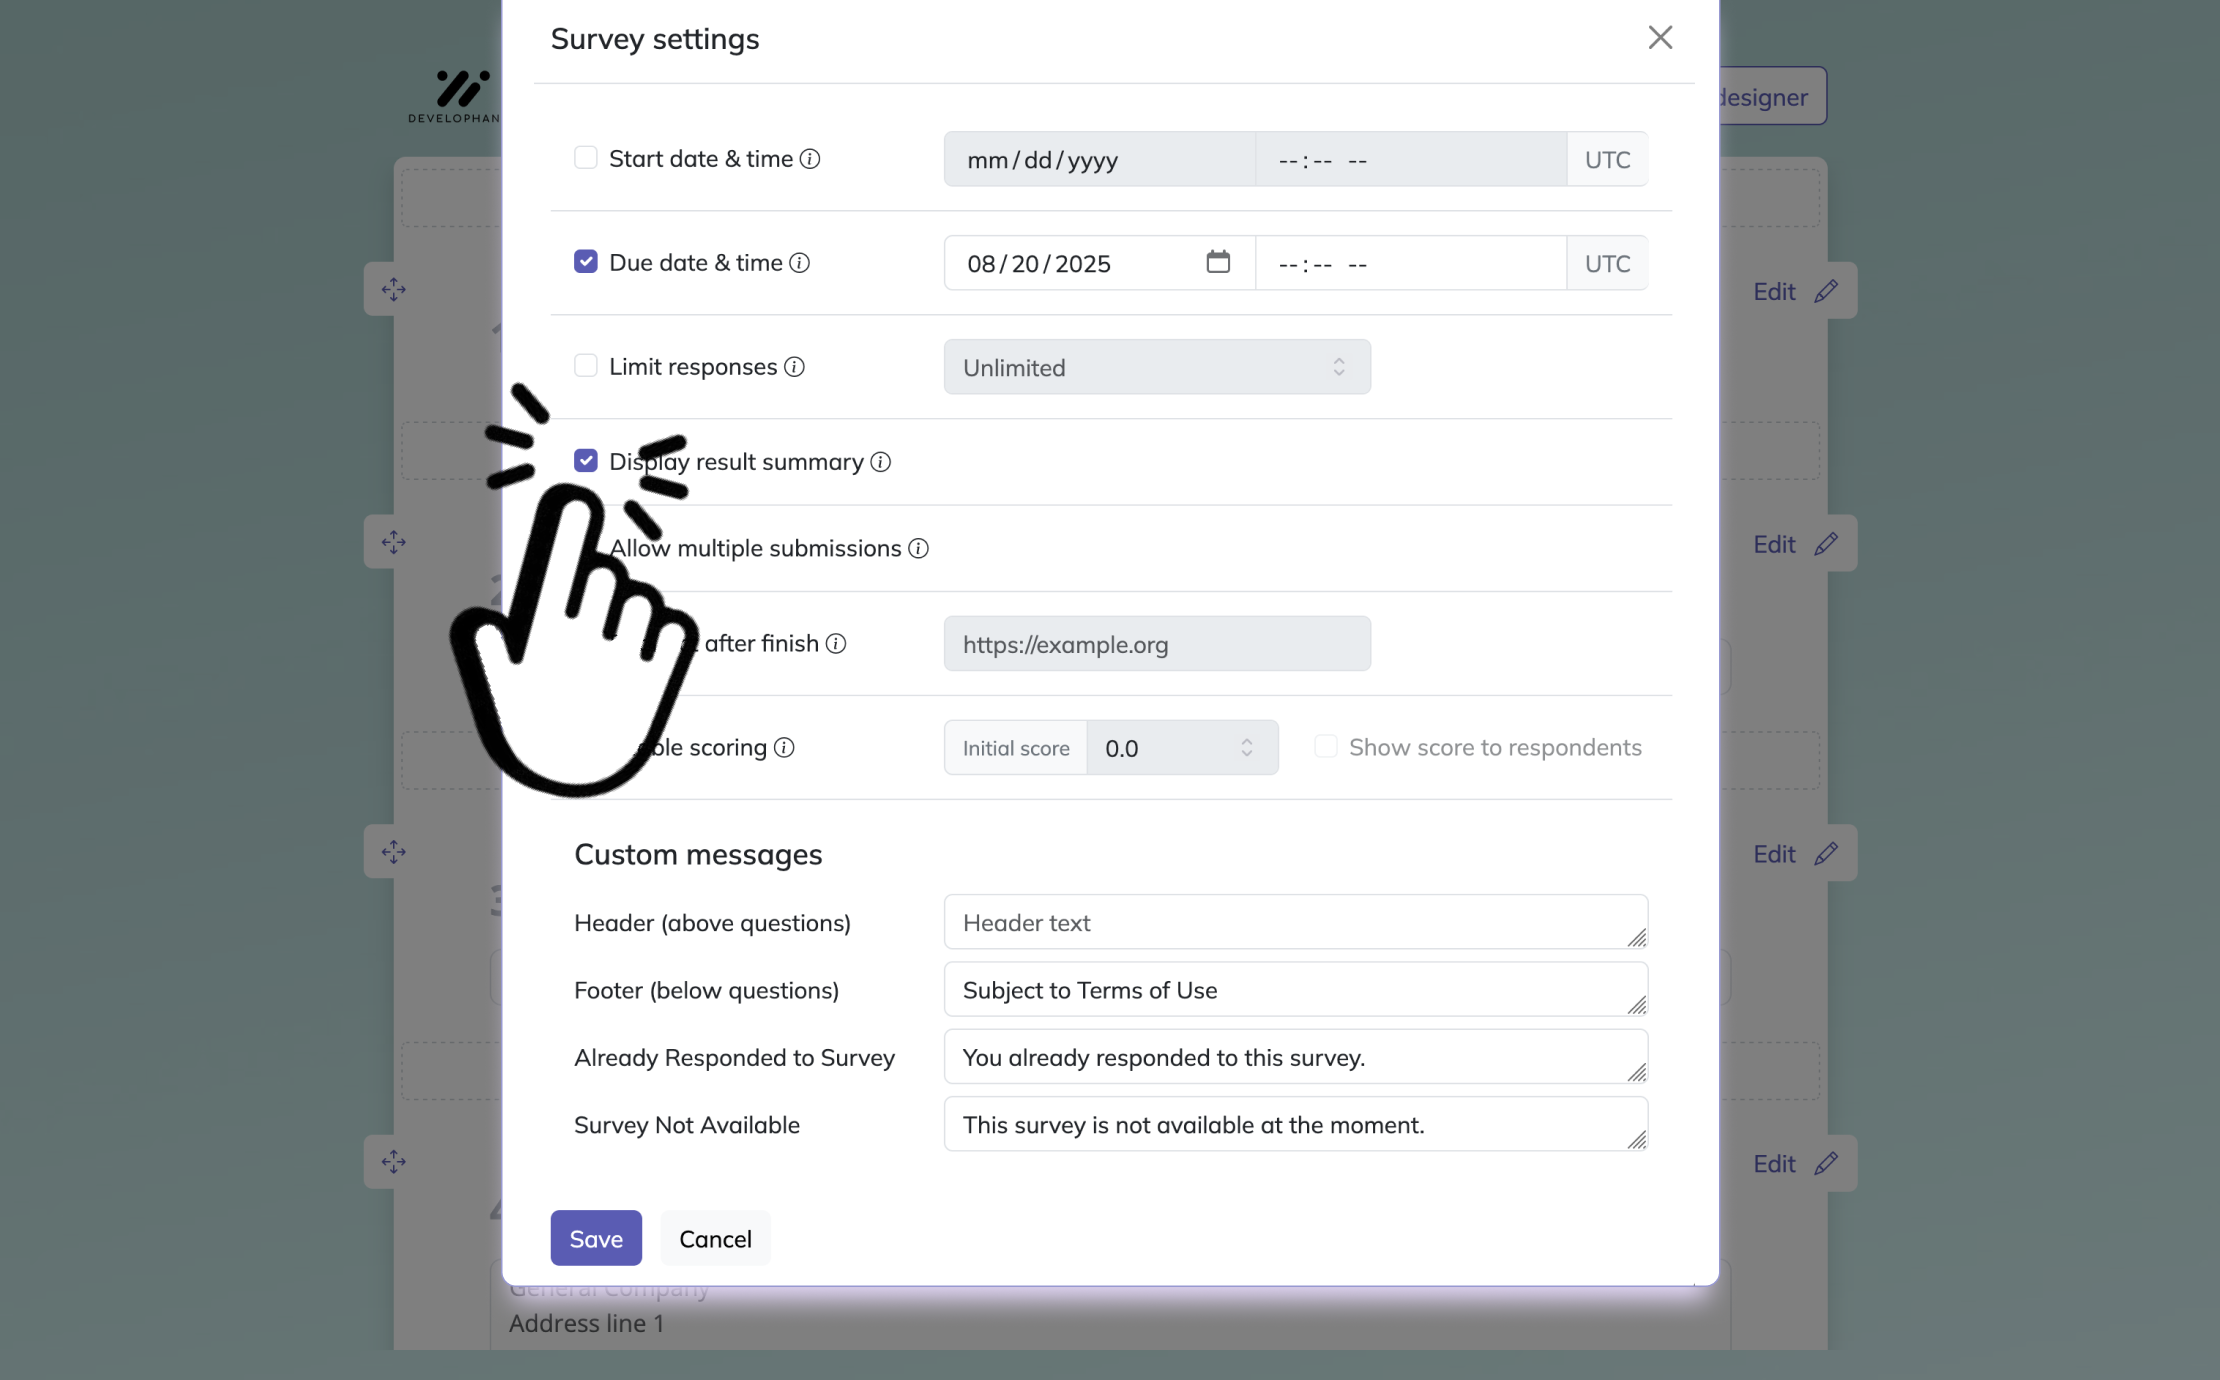
Preview your survey first to check how it looks and works. When everything is ready, click Publish to make it live and get a shareable link. You can then send the survey to respondents and view the collected numerical answers in your results page.
Frequency Questions
Sample questions
How many times did you visit our website in the past 30 days?
How many days per week do you exercise?
How many times have you ordered from us in the last 6 months?
How many hours per day do you spend on social media?
How many customer service issues have you reported in the past year?
great for spotting real-life habits
Why & When to Use
Frequency questions measure how often something happens over a specific period, such as times per day, days per week, or visits per month.
They work best when you want to track behavior instead of opinions, which makes them especially handy for product usage, media habits, attendance, shopping patterns, and everyday routines.
Here’s the thing, these are some of the most useful data survey questions because they help you spot patterns over time instead of just capturing a one-time feeling.
They also fit naturally into range-of response questions examples, since people answer with amounts tied to a clear time frame rather than vague guesses.
If you are building survey questions for statistics project work, frequency formats are gold because the answers are easy to count, compare, group, and chart.
Plus, if you are collecting ideas for 100 survey questions and answers, this type gives you practical, measurable results that play nicely with analysis.
To make frequency questions stronger, keep the timing crystal clear.
Use precise periods like past 7 days, per week, or last 6 months.
Add examples when a behavior may be hard to estimate.
Keep the unit consistent, such as hours, days, or number of times.
Avoid fuzzy wording, or your data may wobble like a shopping cart with one bad wheel.
On top of that, clear time periods make range of response questions examples far more accurate and useful.
Short, specific recall periods improve numerical frequency-question accuracy by reducing underreporting and recall bias in surveys (source).
Quantity and Count Questions
Sample questions
How many products did you purchase from us this month?
How many people live in your household?
How many classes are you currently taking?
How many support tickets has your team handled this week?
How many times have you used this app in the last 7 days?
best when you need exact numbers, not vibes
Why & When to Use
Quantity and count questions ask for a total, amount, or exact number instead of a rating or opinion.
That makes them different from satisfaction scales or range-of response questions examples, because you are collecting hard counts rather than asking people how they feel.
These are strong numerical data questions when you want clean, measurable answers that are easy to sort, compare, and analyze.
If you are building survey questions for statistics project work, this format is especially useful because exact figures support charts, averages, totals, and other examples of numerical statistical questions.
You will often use them for practical topics like inventory, household size, spending, event participation, purchasing behavior, and demographic benchmarking.
Plus, they can help you spot customer value, engagement level, and resource needs without needing to read between the lines like a mind reader on coffee.
Exact counts are usually better than broad ranges when the number really matters.
Use count questions when respondents are likely to know the number.
Choose exact totals for spending, purchases, tickets, or attendance.
Use clear time frames like this week or last 7 days.
Be careful with tricky counts, because some people may guess if they do not know the answer.
On top of that, these fit naturally into 100 survey questions and answers lists, survey questions with answers collections, and other data survey questions that need precise results.
Amount and Spending Questions
Sample questions
How much did you spend on groceries last week?
What is your monthly budget for software tools?
How much did you pay for your most recent online purchase?
How many dollars do you typically spend on dining out each month?
What was the total value of your last order?
money questions work best when they feel safe and simple
Why & When to Use
Amount and spending questions ask people for financial or measurable amounts, such as dollars spent, budget size, income range, or savings totals.
They are useful in consumer surveys, budgeting research, pricing studies, and market segmentation, especially when you want data survey questions that reveal buying habits instead of just opinions.
If you are building survey questions for statistics project work, these can give you strong number-based results that are easy to compare across groups.
Here's the thing, money can feel personal, so wording matters a lot.
You will usually get better answers when you explain why you are asking, how the data will be used, and whether responses stay private, because nobody wants a survey to feel like a surprise audit.
Use exact amounts when people are likely to remember the number and when precision matters for analysis.
Use ranges when recall may be fuzzy or when sensitivity could lower response rates, which is why these sometimes overlap with range-of response questions examples and other range of response questions examples.
Ask for exact figures for recent purchases, last orders, or weekly spending.
Use numerical ranges for income, savings, or larger monthly budgets.
Add trust-building language if the audience may feel cautious about money topics.
Include these in 100 survey questions and answers lists when you want clear spending patterns.
Asking income in categories instead of exact amounts can substantially reduce nonresponse in surveys, improving data completeness for sensitive numerical questions (source).
Ranking and Prioritization Questions
Sample questions
Rank the following features from 1 to 5 based on importance to you.
Rank these factors in order of what most influences your purchase decision.
Please rank our service channels from most to least helpful.
Rank these product improvements by priority for the next update.
Rank the following brands from 1 to 4 based on your preference.
ranking shows what wins when everything cannot be first
Why & When to Use
Ranking questions ask people to assign numbers so you can see order of importance, preference, or priority.
Here’s the thing, rating and ranking are cousins, but they do different jobs.
A rating question measures intensity, like how much you like something on a scale of 1 to 5.
A ranking question measures relative position, which means what comes first, second, or dead last when choices compete for attention.
That makes ranking especially useful when you want survey questions for statistics project work that compare tradeoffs instead of collecting stand-alone scores.
You can use these questions for feature prioritization, service improvement, product development, and brand or competitor comparisons.
Plus, if you are building classroom research or competitor analysis survey questions examples for students, ranking questions give you neat, easy-to-compare results.
They work best when the list is short, because asking someone to rank 12 things is a tiny chaos festival.
Use ranking when you need clear priorities, not just general opinions.
Keep the list short, usually around 4 to 6 items.
Explain the instructions clearly so people do not confuse ranking with range-of response questions examples or simple rating scales.
Add these to 100 survey questions and answers collections when you want sharper comparisons than basic survey questions with answers.
Range-Based Numerical Questions
Sample questions
How many hours per week do you study: 0 to 5, 6 to 10, 11 to 15, or 16+?
What was your monthly spending on streaming services: under $20, $20 to $49, $50 to $99, or $100+?
How many employees are in your company: 1 to 10, 11 to 50, 51 to 200, or 201+?
How many books do you read per year: 0 to 2, 3 to 5, 6 to 10, or more than 10?
How many times have you used our platform this month: 0 to 1, 2 to 5, 6 to 10, or 11+?
ranges make number questions feel easier, faster, and far less nosy
Why & When to Use
Range-based questions are numerical questions that ask people to pick from grouped number bands instead of typing an exact figure.
That makes them perfect when someone does not know the precise answer, or simply does not feel like digging through receipts like a tiny detective.
You will see these often in age brackets, spending bands, usage levels, class size, and project-based research.
Plus, they fit neatly into survey questions for statistics project work because grouped answers are easier to compare, sort, and chart.
If you are collecting range of response questions examples or range-of-response questions examples, this format is one of the most practical to include.
It also works nicely in data survey questions, survey questions with answers, and even a simple 3 question survey when you need quick response-friendly numbers.
Here’s the thing, ranges often improve completion rates when exact answers are hard, while direct-entry numerical survey questions can create more drop-off.
To build good ranges, make sure they do not overlap and that every respondent clearly fits one option.
Use labels like 0 to 5, 6 to 10, and 11 to 15, not messy overlaps like 0 to 5 and 5 to 10.
Keep the band sizes logical for the topic.
Add these to 100 survey questions and answers lists when you want cleaner numeric data without demanding exact figures.
Best Practices for Writing Survey Questions With Numerical Answers
Sample questions
On a scale of 1 to 5, how clear were the survey questions?
How many minutes did it take you to complete this survey?
On a scale of 1 to 10, how comfortable were you answering the numerical questions?
How many of the questions felt difficult to answer accurately?
On a scale of 1 to 5, how relevant were the questions to your experience?
good numerical questions do not just collect data, they protect data quality
Why & When to Use
If you are building better survey questions for statistics project work, this section is your safety net.
Here’s the thing, even excellent question formats can produce messy results when the wording, scale, or context is off by just a little.
That is why strong range-of response questions examples and other data survey questions need careful writing, not just good intentions and a clipboard with main-character energy.
Use these best practices when you want cleaner answers, easier analysis, and fewer confused respondents.
Plus, they are especially useful when creating survey questions with answers, a short 3 question survey, or a bigger bank of 100 survey questions and answers.
Dos
Do use clear units like days, dollars, hours, or visits.
Do define the time frame precisely.
Do keep scale direction consistent throughout the survey.
Do decide between exact numbers and ranges based on respondent recall.
Do pilot-test questions before launch.
Do make sure numerical questions align with the survey goal.
Don’ts
Don’t combine multiple ideas in one question.
Don’t use overlapping ranges.
Don’t switch from low-to-high and high-to-low scales randomly.
Don’t ask for exact numbers when respondents are unlikely to know them.
Don’t overload a short 3 question survey with too many complex numerical inputs.
Don’t ignore how wording affects how to answer survey questions accurately.
On top of that, if you are collecting range of response questions examples, these rules help you turn okay questions into reliable ones.
Common Mistakes to Avoid With Numerical Survey Questions
Sample questions
How satisfied are you with our product?
How much do you usually spend?
How often do you use our service?
Rank all 12 of these features in order of importance.
How many times have you felt happy while shopping with us in your lifetime?
small wording mistakes can wreck perfectly good survey data
Why & When to Use
This section helps you spot why survey data turns messy, unreliable, or weirdly impossible to analyze.
Here’s the thing, many survey questions for statistics project work fail not because the topic is bad, but because the wording is vague, the units are missing, the scale is clunky, or the memory task is way too big.
That matters whether you are building business feedback forms, classroom research, or data survey questions for a formal study.
Use these fixes when you want stronger range-of response questions examples, clearer survey questions with answers, and cleaner results for anything from a 3 question survey to 100 survey questions and answers.
“How satisfied are you with our product?” fails because it gives no response scale. Improve it with: “On a scale of 1 to 5, how satisfied are you with our product?”
“How much do you usually spend?” is too vague. Improve it with: “About how many dollars do you spend per month on our product?”
“How often do you use our service?” needs a time frame. Try: “How many times per week do you use our service?”
“Rank all 12 of these features” creates respondent fatigue. Plus, ask people to choose their top 3 instead.
“How many times have you felt happy while shopping with us in your lifetime?” asks for impossible recall. A better version is: “During the past 30 days, how many shopping visits felt enjoyable?”
How to Turn Numerical Survey Responses Into Action
Sample questions
Which score range indicates a customer may be at risk of leaving?
What average satisfaction score should trigger a service review?
How many monthly purchases define a high-value customer?
What usage frequency suggests a customer is highly engaged?
Which spending range should be targeted with premium offers?
numbers only matter when they help you decide what to do next
Why & When to Use
Collecting data is nice, but action is the whole point.
Here’s the thing, the best range-of response questions examples do more than fill a spreadsheet. They help you decide what to fix, what to improve, and what is already working like a champ.
Use this approach when reviewing customer experience, employee feedback, classroom research, or survey questions for statistics project assignments. Plus, it works just as well for a simple 3 question survey as it does for 100 survey questions and answers.
Start by grouping responses into useful bands so the numbers tell a clearer story.
Low scores can reveal pain points that need fast attention.
middle-range scores can show hesitation, inconsistency, or room to improve.
High scores can highlight strengths worth promoting more often.
On top of that, compare results by segment. Look at differences by age group, location, class section, customer type, or usage level so your data survey questions lead somewhere useful.
Watch for patterns like averages, outliers, and threshold points.
If one group scores far lower, that becomes a priority.
If one spending range responds better, that group may fit premium offers.
If high usage links with high satisfaction, you may have found your loyalty sweet spot.
In short, survey questions with numerical answers give you cleaner decisions, not just prettier charts.
Related Question Design Surveys

29 Quantitative Survey Research Questions Examples
Explore 25 sample quantitative survey research questions and survey questions example to guide re...
28 Good Survey Questions
Discover 25 good survey questions to improve feedback quality, boost response rates, and inspire ...
29 Survey Questions Mistakes
Discover 25 survey questions mistakes with sample questions and expert tips to improve responses,...