27 Keyword Ratio Survey Questions Examples for Effective Analysis
Explore 25 ratio survey questions examples designed to boost data accuracy and insights. Discover the best ratio survey questions now.
If you want survey insights that are crisp, clear, and deeply actionable, ratio data questions are your best friend.
Unlike basic categories or abstract ratings, these gems let you measure how much of something really happened, all the way down to zero, so your numbers stop guessing and start behaving.
Whether you track spending, count gym sessions, or analyze customer wait times, ratio scale survey items reveal the real story.
On top of that, you are about to explore ratio survey questions and how to use them for data that works as hard as you do with an online survey maker.
What Are Ratio Survey Questions & Why They Matter
Ratio data examples reveal “how much” and never just “which one”
Ratio survey questions use ratio scales that capture exact values starting from a true zero, so you measure things like dollars, minutes, or number of items instead of just picking from a list or vaguely checking how often something happens.
You get hard numbers, not fuzzy guesses, which makes your inner data nerd very happy.
Here's the thing:
Ratio scales have all the powers of nominal, ordinal, and interval data, plus a real zero.
Because they start from zero, you can say things like “twice as many,” “three times as long,” or “half the cost,” and actually mean it.
This is different from nominal questions (favorite fruit), ordinal (order of finish), or interval (temperature with no true zero).
When does this matter most? When you need precise, numerical results to drive big decisions.
HR uses examples of ratio measurement for hours worked or days off.
Marketers tackle customer spend with ratio data examples.
Researchers crunch numbers on health, productivity, and purchasing with ratio question examples.
Plus, ratio scale questions are gold for statistical analysis because you can average, sum, multiply, or even run regressions with their results, which is like giving your spreadsheets superpowers.
Many ratio data examples make a real difference in everyday life, including hours spent in meetings, number of coffees sipped, and how many products get shipped.
When you want numbers, not opinions, you reach for ratio scale questions.
“Approximate how many minutes per day you use this app?” enables true-zero measurement and supports meaningful ratio comparisons like “twice as long.” “What are some popular ratio scale examples… time or duration”

Certainly! Here is a set of instructions (approx. 250–350 words) specifically for creating a survey with HeySurvey, tailored for first-time users, in three main steps plus bonus tips:
How to Create Your Survey with HeySurvey in 3 Easy Steps
Creating a survey with HeySurvey is simple and intuitive, even if you’ve never used the platform before. Just follow these three steps to launch a professional, customized survey in minutes with our online survey maker:
Step 1: Create a New Survey
Click the “Start from Template” button below or choose to create a survey from scratch. Either way, HeySurvey will open the Survey Editor for you. In the editor, give your survey a name for easy future reference. If you’re using a template, the first questions will load automatically—these can be modified or removed as needed.
Step 2: Add and Edit Questions
To add your own questions, press the “Add Question” button at the top or between existing questions in the editor. Select from question types such as text, multiple choice, scale (e.g., Likert or NPS), file upload, or date. For each question, simply type the question text, add options or descriptions, and mark whether it's required. Enhance your survey by attaching images via upload or choosing from Giphy or Unsplash. If you need to collect different information based on answers, use branching to direct respondents along different paths.
Step 3: Preview and Publish Your Survey
Click “Preview” to see what your survey will look like for respondents. Make adjustments as needed. Once satisfied, click “Publish.” You’ll be prompted to create a HeySurvey account if you haven’t already—this ensures you can access responses and manage your surveys later. After publishing, you’ll receive a shareable link and embed code.
Bonus Steps for a Professional Touch
- Branding: In the branding panel, add your company logo and set your preferred colors, fonts, or background images for a consistent look and feel.
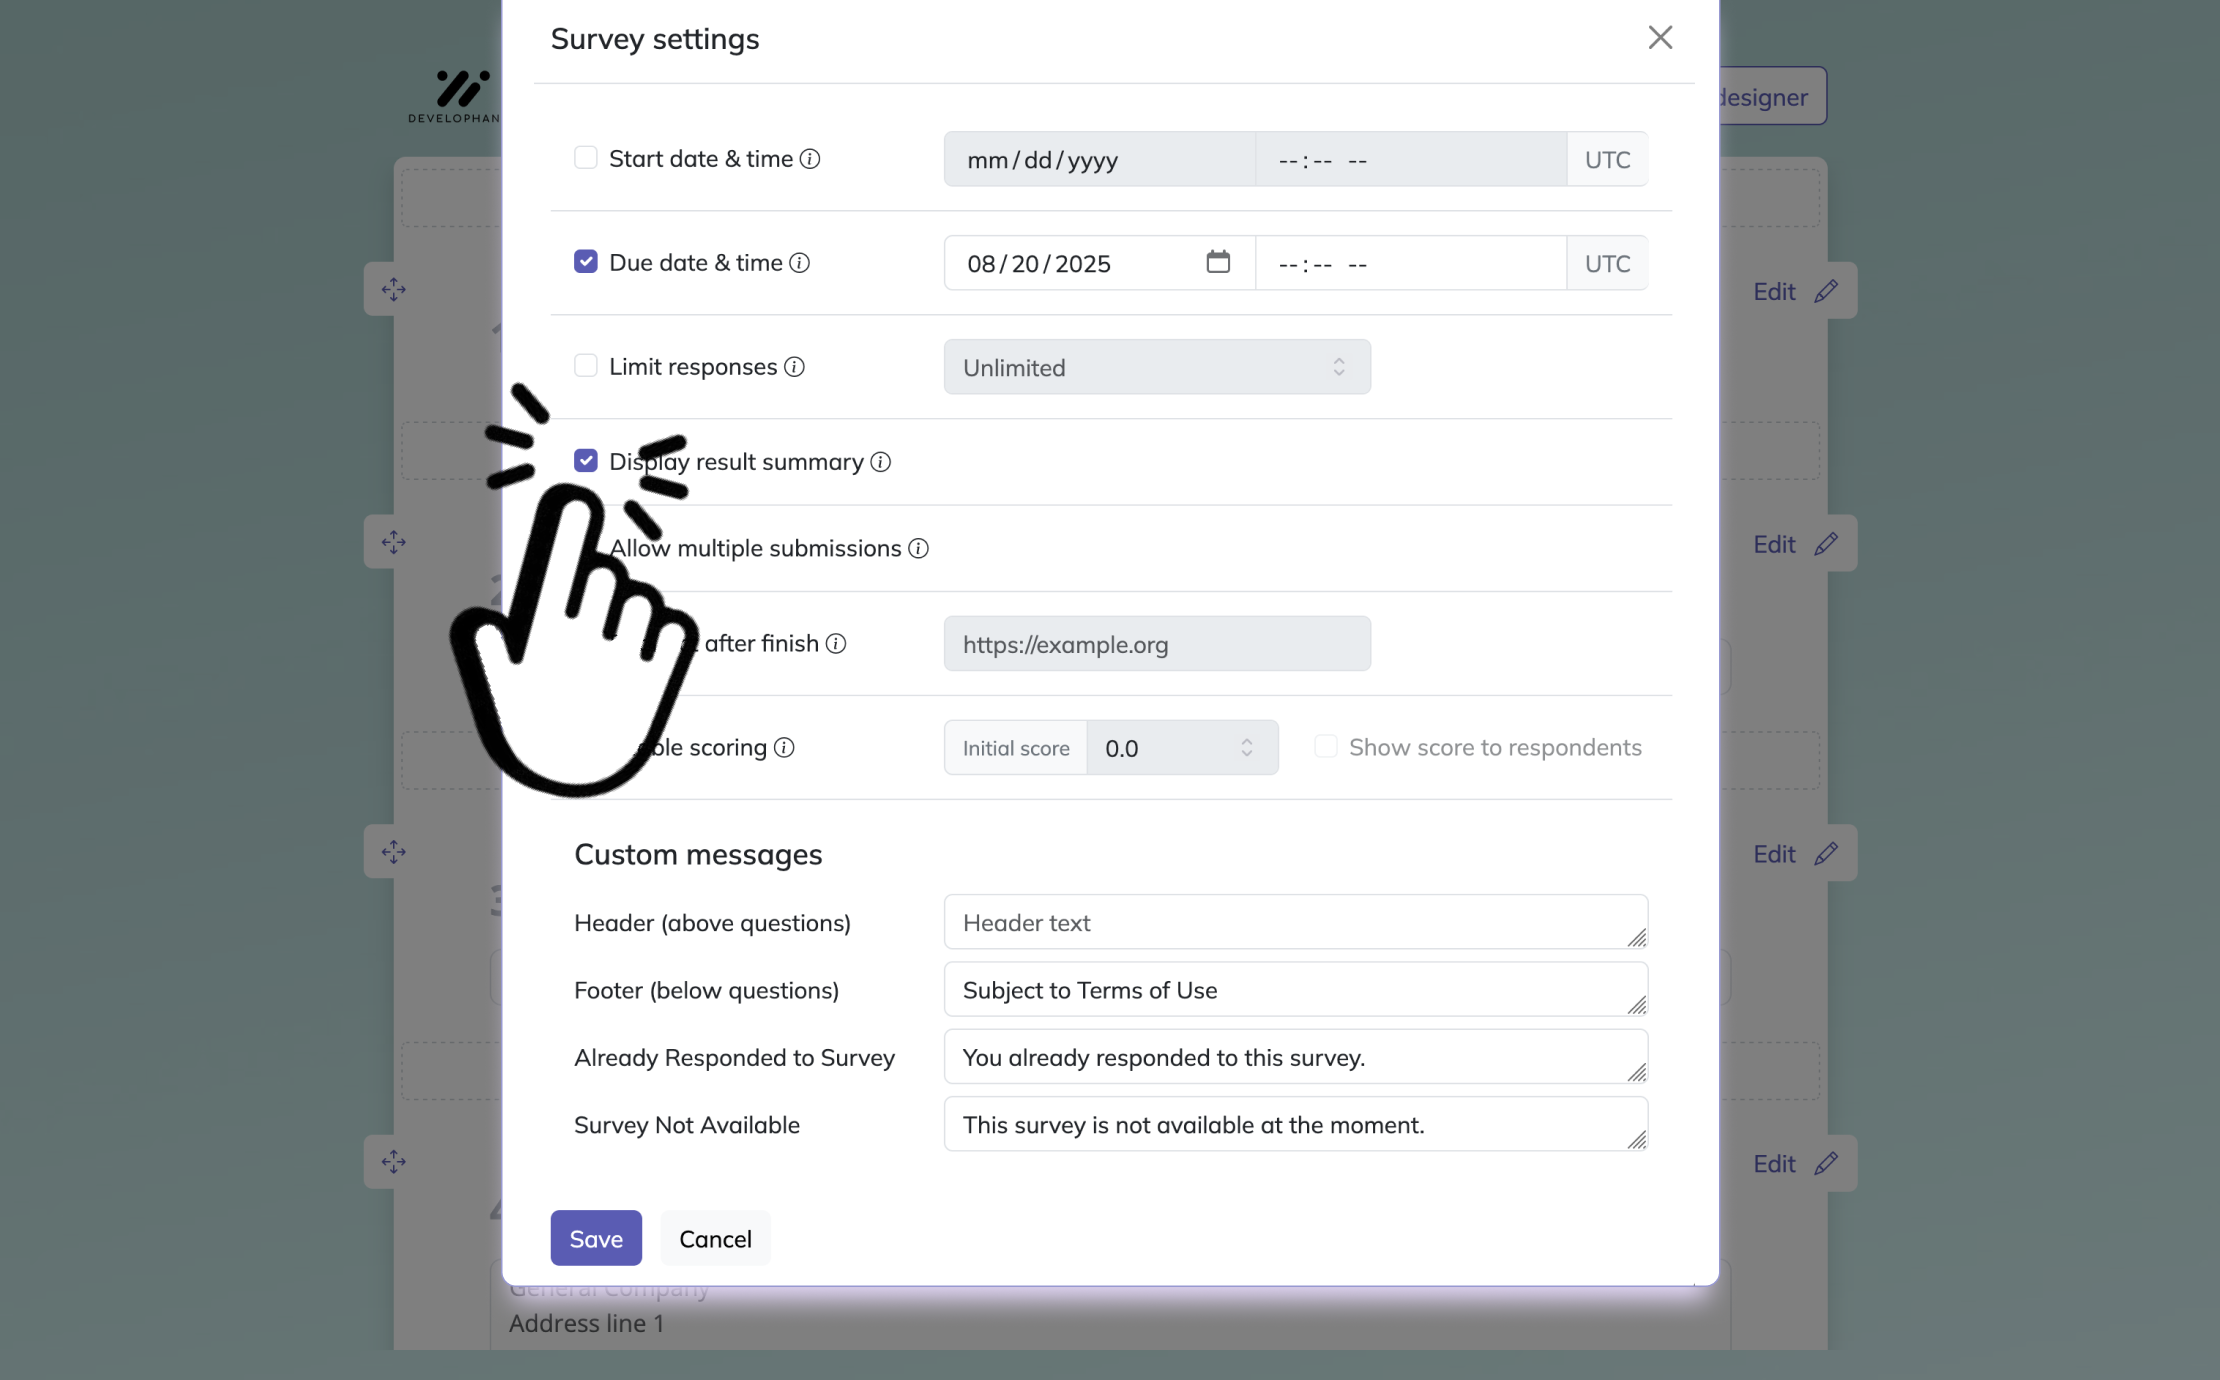
- Survey Settings: Open the settings panel to limit responses, define open/close dates, configure custom end messages, or set up redirects for after survey completion.
- Branching: Create conditional logic so respondents only see relevant questions based on their previous answers.
Ready to get started? Click below to open your survey template and begin customizing!
Spending & Budget Ratio Questions (Monetary Data)
Precise dollar amounts power profit and pricing insights
You care about money, and when you need exact financials, only ratio questions will do.
Every dollar counts, whether you’re budgeting for groceries, tracking donations, or measuring product upgrades.
For marketers, researchers, nonprofits, and finance teams, ratio monetary questions are essential.
Here’s the thing: why go with ratio scale here?
Lets you analyze real spending patterns, not just “low/medium/high” ranges.
Supports advanced models (like ROI calculations or geometric means) because you have exact numbers.
Great for A/B pricing tests and donation impact studies, so you can stop guessing and start proving.
When should you use these types of ratio question examples?
Pricing a new product
Evaluating customer lifetime value
Determining campaign or event ROI
Comparing spending across time or segments
Here are five powerful examples of ratio data questions on spending:
How much, in US dollars, did you spend on groceries last week?
What is your average monthly subscription budget for streaming services?
Enter the total amount you donated to charities in the past 12 months.
How much would you be willing to pay for our premium upgrade?
State your household’s annual clothing expenditure in dollars.
When you include precise monetary values, you can segment customers and uncover trends with real confidence.
Plus, it is oddly fun to see who spends the most on coffee.
Ratio-scale monetary survey questions (e.g. “How much did you spend?”) enable meaningful proportional comparisons like “twice as much,” supporting advanced statistical analyses. (askattest.com)
Let me know if you'd like additional findings or examples!
Time-Based Ratio Questions (Duration & Latency Data)
Exact time tracking drives true process improvement
Time is money (and sometimes your last nerve), so getting the details right really matters. Time-based ratio scale questions help you see both the big picture and the tiny delays that quietly pile up.
Whether you work in HR, UX, logistics, or research, you can unlock big wins when you track durations down to the minute.
So why use ratio data here?
You get a true “zero” anchor, like "no minutes," "no hours," or "no days."
Benchmarking becomes accurate, so you can honestly say one task takes twice as long as another.
With exact numbers, you can measure the effects of process changes, software updates, or even your favorite personal productivity hacks.
Need use cases? Think:
Timing commutes or workflow steps for UX improvements
Auditing staff time for HR reviews
Tracking time on customer onboarding to optimize experience
Measuring downtime in manufacturing
Here are five useful examples of ratio measurement for time:
How many minutes did today’s commute take door to door?
In hours, how long is your average focused work session?
How many days of paid vacation did you actually use last year?
Enter the total time (in seconds) it took to complete checkout.
How many hours of online training have you completed this quarter?
Here’s the thing: ratio questions turn your vague “takes a while” into clear, measurable actions. You can compare before-and-after data, run averages, and spot productivity boosts, all thanks to exact numbers you can track over time.
Frequency Ratio Questions (Count of Occurrences)
Counting each time sharpens customer and user insights
You do not just want to know how often something happens, you want to know exactly how many times it happens.
Ratio frequency questions help you track behaviors, predict patterns, and model outcomes, whether you are looking at churn rates, user engagement, or even coffee cups.
Here’s the thing: when you pick ratio here, you unlock:
The power of exact counting, perfect for Poisson regression and predictive analytics
Ability to model churn, feature adoption, or event spikes with summed, averaged, or divided tallies
Less ambiguity, so you skip the confusing “add up all the sometimes”
On top of that, you can plug these ratio questions examples into:
Product analytics (logins, features used)
Behavioral research (habits, purchases)
Epidemiological studies (cases, exposures)
Fitness and health tracking (workouts, incidents)
Here are five frequency-based examples of ratio data you can drop into your next survey (quantitative survey research questions survey questions example):
How many times did you log in to our app last week?
Number of cups of coffee you drink on an average weekday:
How many support tickets have you opened in the past 30 days?
Enter the total books you purchased this year.
How many workouts did you complete in the last 14 days?
Plus, ratio scale questions usually beat those “pick a range” options, because you can understand frequency, spot changes, and forecast trends down to the very last click or sip.
Ratio-scale survey questions capture exact counts (e.g., “How many times have you purchased from this brand in the past three months?”), yielding precise, analyzable frequency data (askattest.com)
Physical Measurement Ratio Questions (Height, Weight, Distance, etc.)
Physical stats deliver machine-precision in survey insights
You use physical measurement questions with ratio data when you want hard, objective numbers that start at true zero. Doctors, coaches, logistics specialists, and smart home designers all rely on these to turn height, weight, distance, volume into clear decisions, not guesswork.
Why use them?
Every response starts at a real zero, so you never deal with negative heights or imaginary miles.
You can convert between units, like lbs to kg or miles to km, without breaking the math.
They are perfect for correlations, so you can see how taller people, heavier shipments, or faster runners tell you the exact story in numbers.
Use cases for ratio measurement include:
Health surveys that track BMI, water intake, or other body stats over time.
Logistics and shipping audits that measure weight, volume, and distance for every shipment.
Sports science studies that analyze performance stats and distances run.
IoT sensor reporting that logs environmental volumes and energy use.
Try these examples of ratio questions when you want physical accuracy:
What is your current weight in pounds?
Enter your height in centimeters.
How many kilometers did you run last week?
What is the payload weight (in kg) of your last shipment?
How many liters of water does your household consume daily?
You can average, sum, or slice these numbers any way you want for deeper insight. Plus, it is surprisingly fun to compare your own stats, even if your water intake only reaches Olympic levels in the middle of summer.
Demographic Count Ratio Questions (People, Units, Items)
Exact counts fuel demographic brilliance and inventory wins
When you care about detail, ratio data examples in demographic and count questions help you get very specific with numbers. You skip ranges and categories so you get clean, counted results that tell you exactly who or what is in the mix.
Plus, ratio data helps you answer simple questions like who’s in the room or how many gadgets you own with real precision. Your survey stops guessing and starts measuring.
Why ratios matter for counts
Here’s the thing: zero actually tells you something when you use ratio data.
Zero really means “none” (for example, no kids, no employees, no inventory).
Per-capita analytics work only with real ratios, not rounded bins.
Demand forecasting, resource allocation, and trend-tracking become far more accurate with precise counts.
Where you’ll want to use these
You will reach for ratio counts whenever you need solid demographic or operational numbers. On top of that, they give you data that ages well over time.
Census or social research (household population, dependents)
Retail and operations (stock, inventory)
Education and classroom analytics (student counts, devices owned)
Hospitality and event staffing (guests, teams, hosts)
Ratio question examples you can plug in today
Here are five ratio questions examples you can drop into your next form for clean demographic insights. They keep your data sharp and your analysis future friendly.
How many employees work at your primary location?
Number of children under 18 living in your household:
How many devices (phones, tablets, laptops) do you personally own?
How many units of Product X are currently in inventory?
Enter the total guests you hosted last month.
With these examples of ratio measurement you can calculate averages, compare between groups, and spot demand hotspots, all while quietly admiring your own device collection.
Performance & Productivity Ratio Questions (Output Metrics)
Output numbers bring clarity to performance analysis
When you count what you produce, whether it is phone calls, manufactured widgets, or research breakthroughs, you finally see what is really happening.
Performance ratio questions help you pin down output with zero-based accuracy, turning vague “good” or “bad” into trackable stats that actually mean something, and these examples of ratio data power your dashboards, scorecards, and continuous improvement.
Ratio data rocks here because:
You can measure productivity per hour, per person, or per dollar
There is no upper limit, so you can track top performers, teams, or trends over time
Every result starts from zero, so you can truly say “no output” or “all-time high”
Applications?
Sales and business development (calls, deals, revenue)
Engineering and dev teams (issues closed, features released)
Manufacturing (units per shift, error rates)
Academia (publications, patents)
Here are five classic productivity ratio question examples:
How many sales calls did you complete yesterday?
Enter the dollar value of deals you closed this quarter.
How many bugs did you resolve in the last sprint?
What is your average units-produced-per-hour rate?
How many research papers have you published to date?
It feels great to see output, effort, and improvement written in digits, not just words.
Plus, who does not enjoy watching their numbers climb or spotting the sneaky bottleneck that has been quietly slowing your team down?
Best Practices: Dos & Don’ts for Crafting Ratio Survey Questions
Great ratio questions have clear units and zero confusion
When you write ratio scale questions, you tap into some serious survey superpowers, but it does take a bit of finesse. If you want numbers you can trust and analyze with confidence, follow these tips so your data, and your sanity, stay intact.
Bold move: focus on a true zero and clean, consistent units.
Dos:
Use a true zero baseline, and do not assume everyone starts above zero.
Specify units clearly in the question, like minutes, dollars, or kilograms, so no one has to guess.
Offer input validation and set sensible range checks to catch typos and stop wild outliers before they sneak in.
Pilot test your questions with a small cohort, watching for fatigue or confusion when people face long numerical entries.
Don’ts:
Do not mix units, like dollars and euros, in the same question, and stick to just one.
Do not pre-bucket or round off responses before data entry, because that removes the ratio power and leaves you with only interval or ordinal data.
Do not forget to warn respondents about privacy if you ask for sensitive information, such as income.
Do not set random upper limits that cut off real extremes, since millionaires and marathoners really do exist.
Simple tweaks like these give you better data, fewer dropouts, and more actionable insights. Plus, your respondents will silently cheer you for not making them convert ounces to liters in their heads.
When you unlock the power of ratio scale questions, you unlock deeper and more flexible analytics that you can actually use. These questions let you slice, dice, and average your way to answers that drive real decisions for product teams, HR, marketers, and researchers.
On top of that, whenever you need true zero anchored numeric insights, you can reach for ratio survey items every single time. Pair these questions with demographic filters for juicy, segmented results that feel almost unfair in how useful they are.
You can download a free template of ratio survey question examples to plug into your next project. Or, if you want to nerd out a bit more, check out the in-depth guide on interval vs. ratio scales to take your survey game to the next level.
Related Question Design Surveys

29 Quantitative Survey Research Questions Examples
Explore 25 sample quantitative survey research questions and survey questions example to guide re...

28 Good Survey Questions
Discover 25 good survey questions to improve feedback quality, boost response rates, and inspire ...
29 Survey Questions Mistakes
Discover 25 survey questions mistakes with sample questions and expert tips to improve responses,...