31 Numerical Survey Questions
Explore 25 numerical survey questions with sample questions, examples, and tips to create clear, data-driven surveys for better insights.
If you have ever wondered what is a numerical question, you are in the right place. Numerical survey questions ask people to answer with a number like a count, rating, percentage, amount, frequency, or estimate, instead of writing a full response or picking from fixed choices.
That makes them different from open-ended and multiple-choice formats, and very handy when you want clean data you can compare fast. Plus, whether you are asking how many questions should be in a survey, how many questions should a questionnaire have, or how many questions in a questionnaire work best, numbers make decisions far less guessy, especially when using an online survey maker.
Sample questions
How many times have you used our product in the past 30 days?
On a scale of 0 to 10, how likely are you to recommend our brand to a friend?
How many minutes did it take you to complete your purchase today?
What percentage of your team uses this tool every week?
How much do you spend on this category in a typical month?
What Are Numerical Survey Questions?
Numerical survey questions turn opinions, habits, and experiences into data you can actually measure.
Before getting into specific survey types, it helps to lock down the basics. If you are wondering what is a numerical question, it is simply a question where the respondent gives a number instead of a long written answer.
That numeric response might be a count, rating, percentage, dollar amount, number of hours, or even a range turned into a number. In plain English, showing a numerical response means someone types or selects a value you can measure directly, compare easily, and chart without breaking a sweat.
These numerical questions work especially well when you need fast, tidy data in places like customer feedback, employee surveys, product research, event feedback, market research, pricing studies, and operational audits. Plus, if you are also thinking about how many questions should be in a survey, numerical formats often help you keep things shorter and clearer.
Here’s the thing, good numerical questions to ask are specific and use clear units.
Use days, dollars, hours, percentages, or ratings so people know exactly what to enter.
Add validation ranges when needed, like 0 to 100 for percentages or 0 to 10 for ratings.
Each sample above is numerical because the answer can be counted, averaged, compared, or tracked over time.
That is why, when deciding how many questions should a questionnaire have or how many questions in a questionnaire make sense, numeric questions are often the efficient little overachievers.
Sample questions
How many times have you purchased from us in the last 6 months?
How many customer support issues did you report this quarter?
How many employees on your team actively use this software?
How many events have you attended with our company in the past year?
How many competitors did you evaluate before choosing a solution?
Clear, specific survey questions with well-defined response options improve answer accuracy and reduce measurement error in questionnaires (Pew Research Center).
How to create a numerical survey in HeySurvey
1. Create a new survey
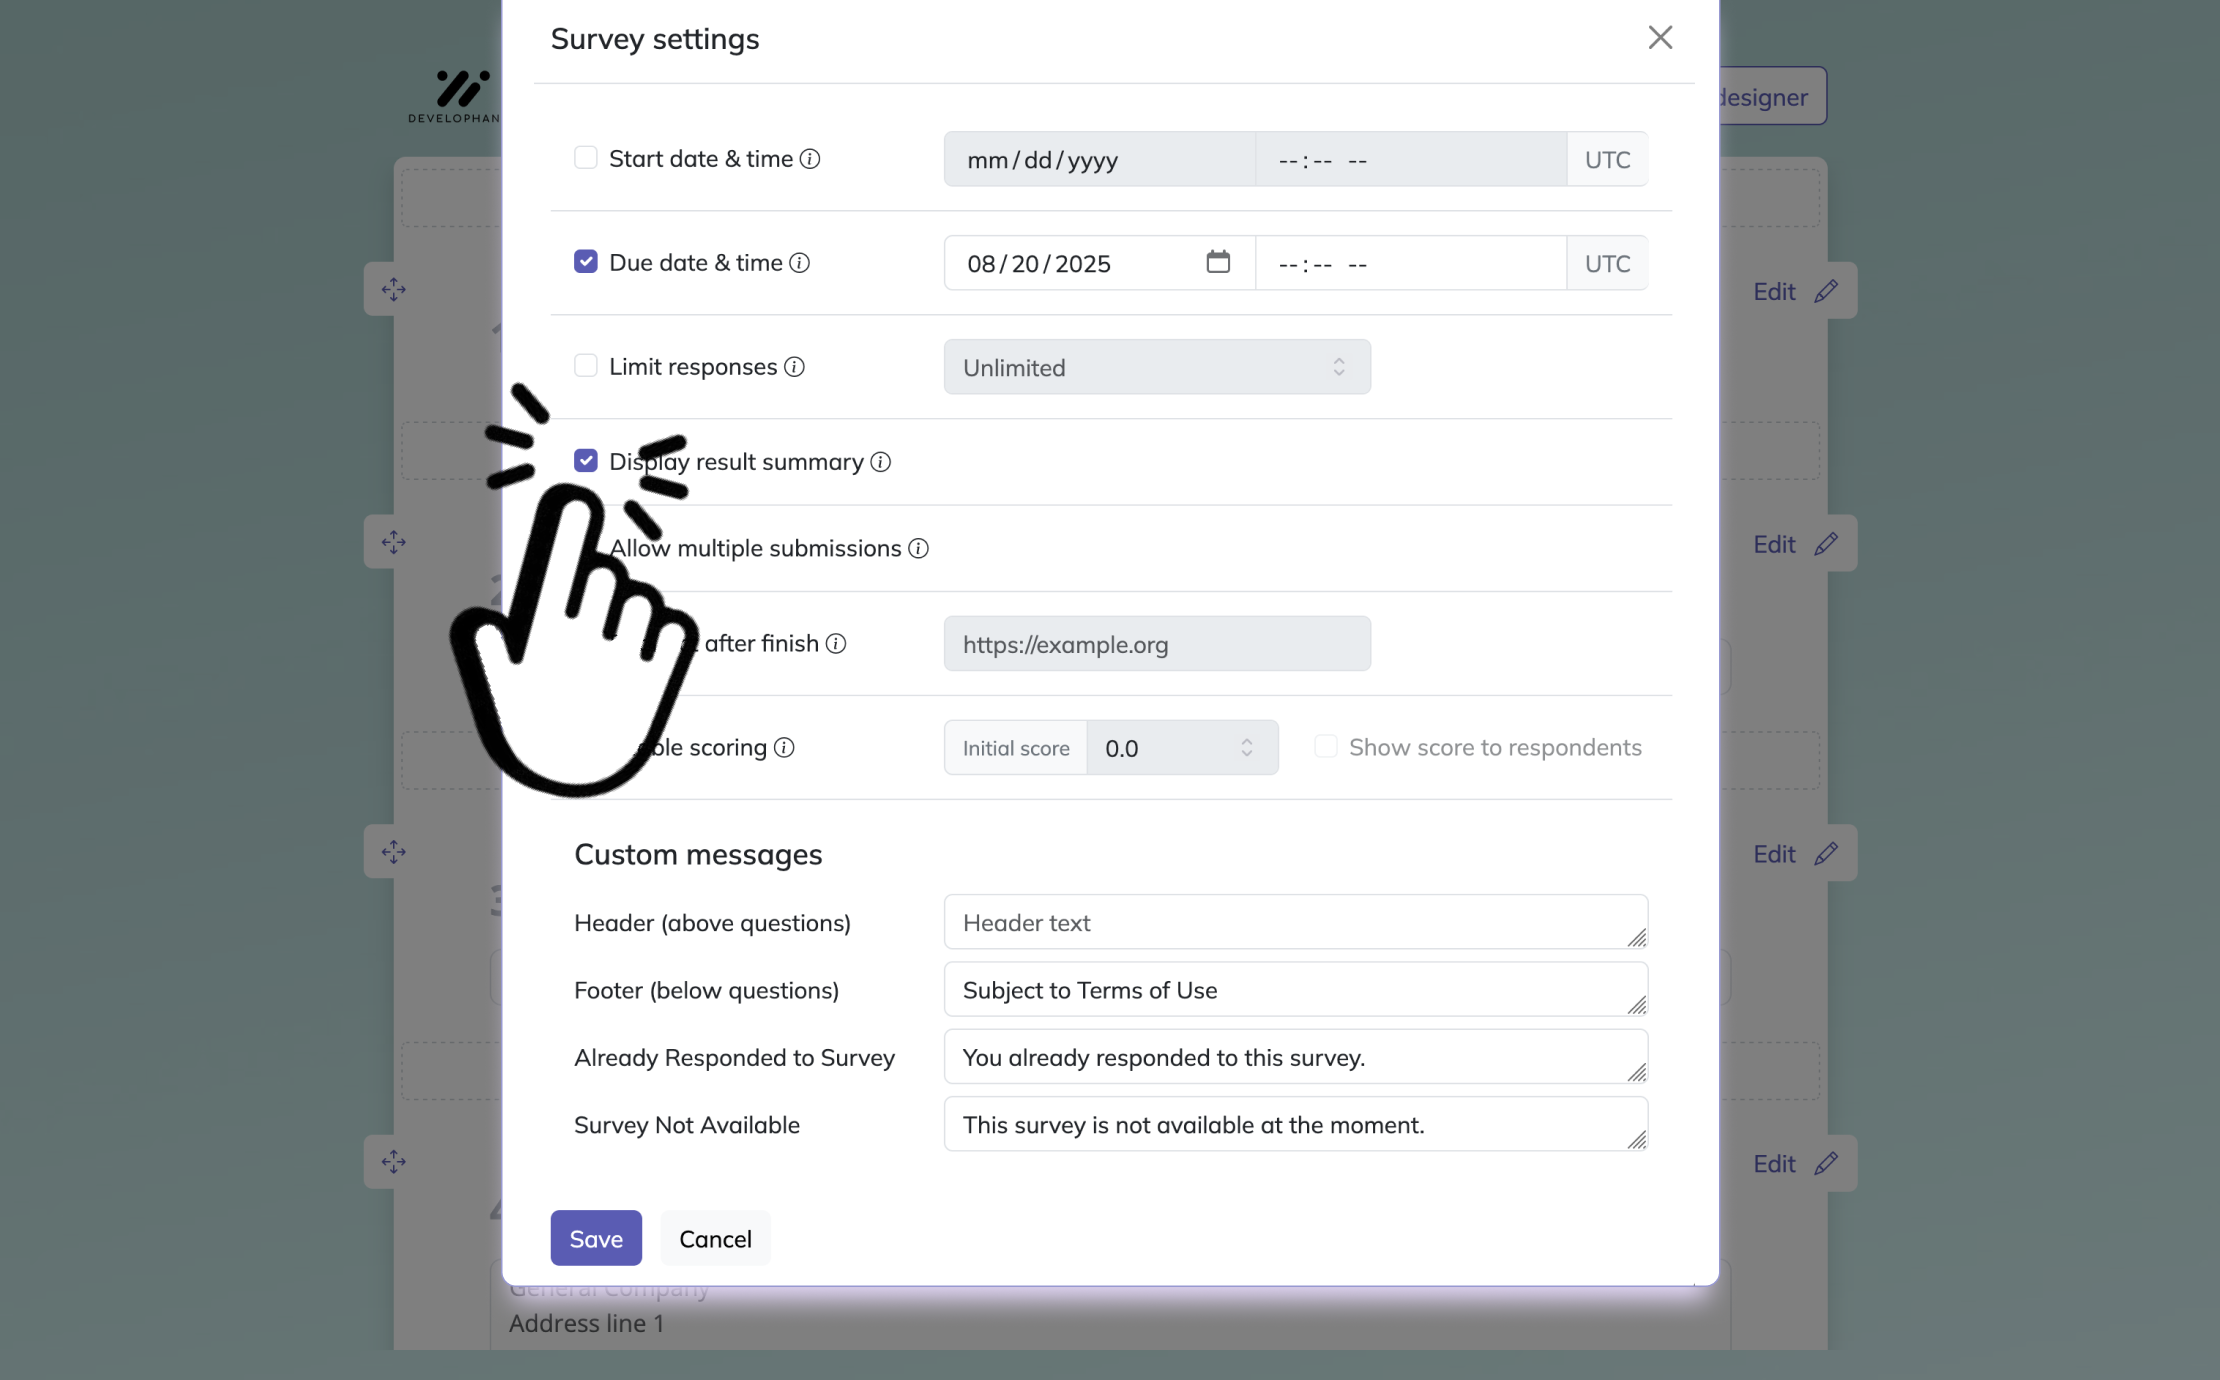
Start by opening a template below this guide, or create a new survey from scratch. If you are new to HeySurvey, a template is the quickest way to begin. You can work without an account, but you will need one to publish and collect responses later. After the survey editor opens, you can rename your survey and adjust basic settings if needed.
2. Add questions
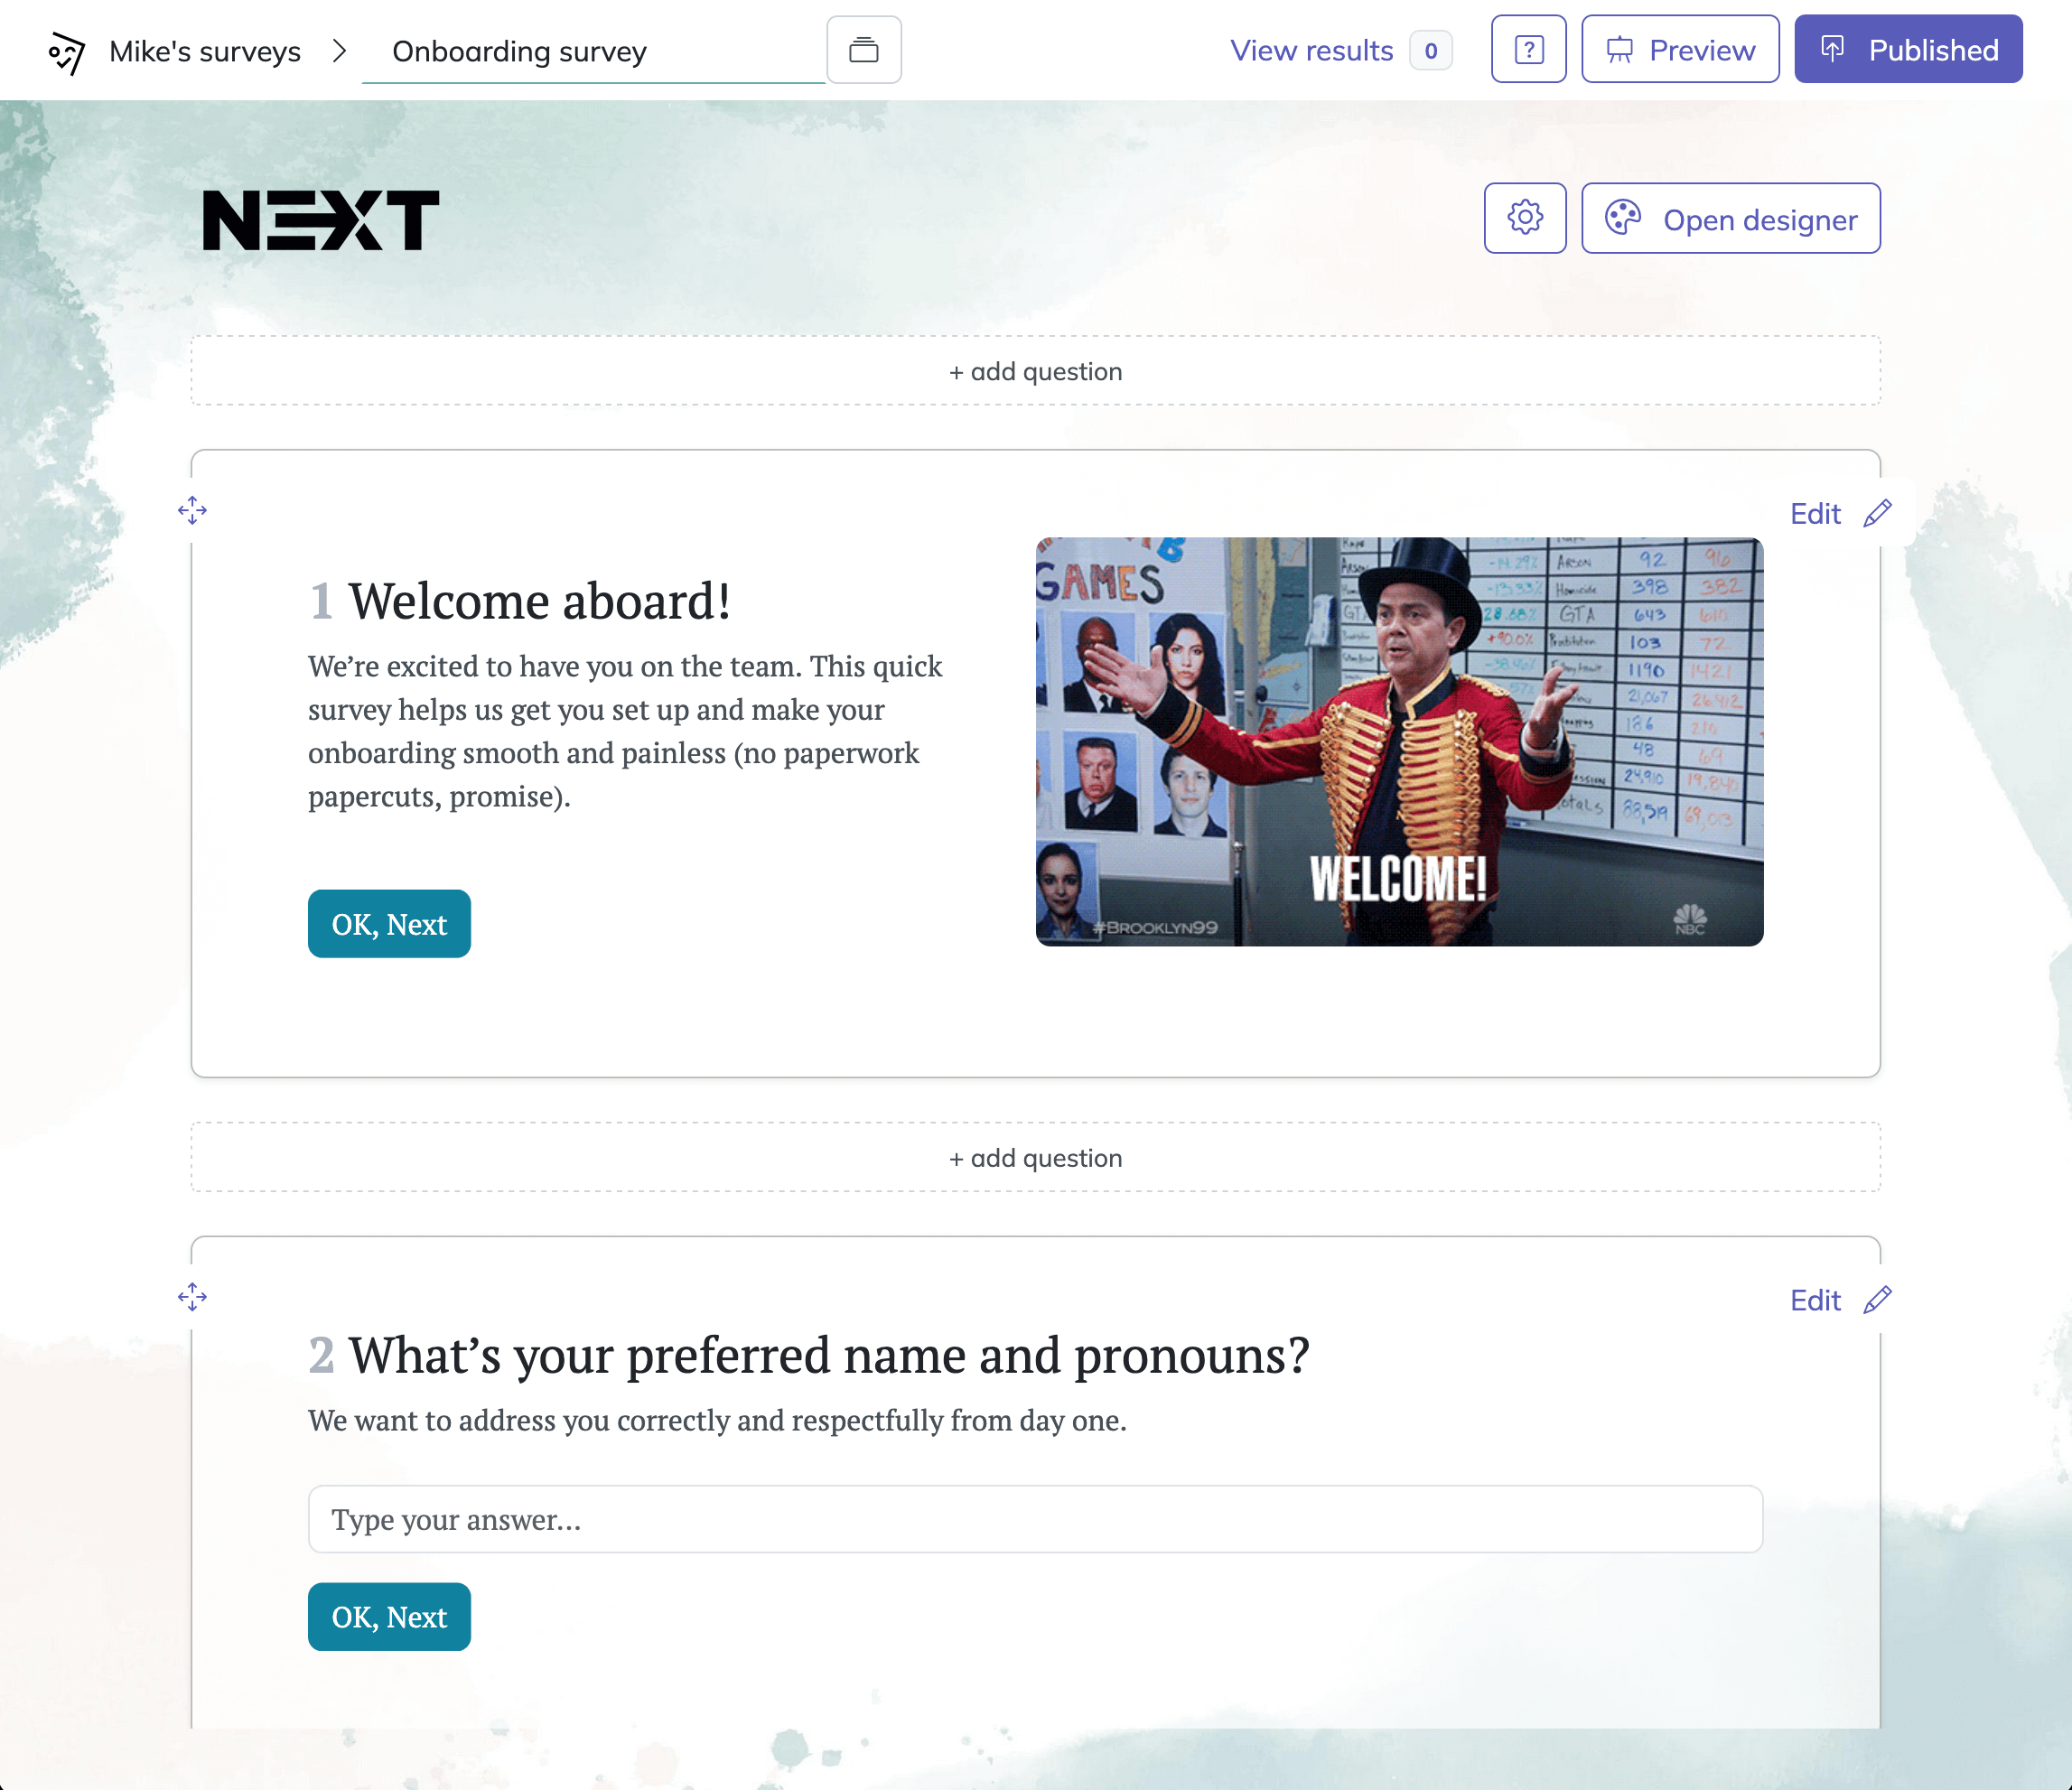
Click Add Question and choose Number for each numerical question you want to ask. Type your question text, add a short description if needed, and mark the question as required if respondents must answer it. You can repeat this for as many number questions as your survey needs. If you want, you can also add simple instructions or extra context before the questions.
3. Publish survey
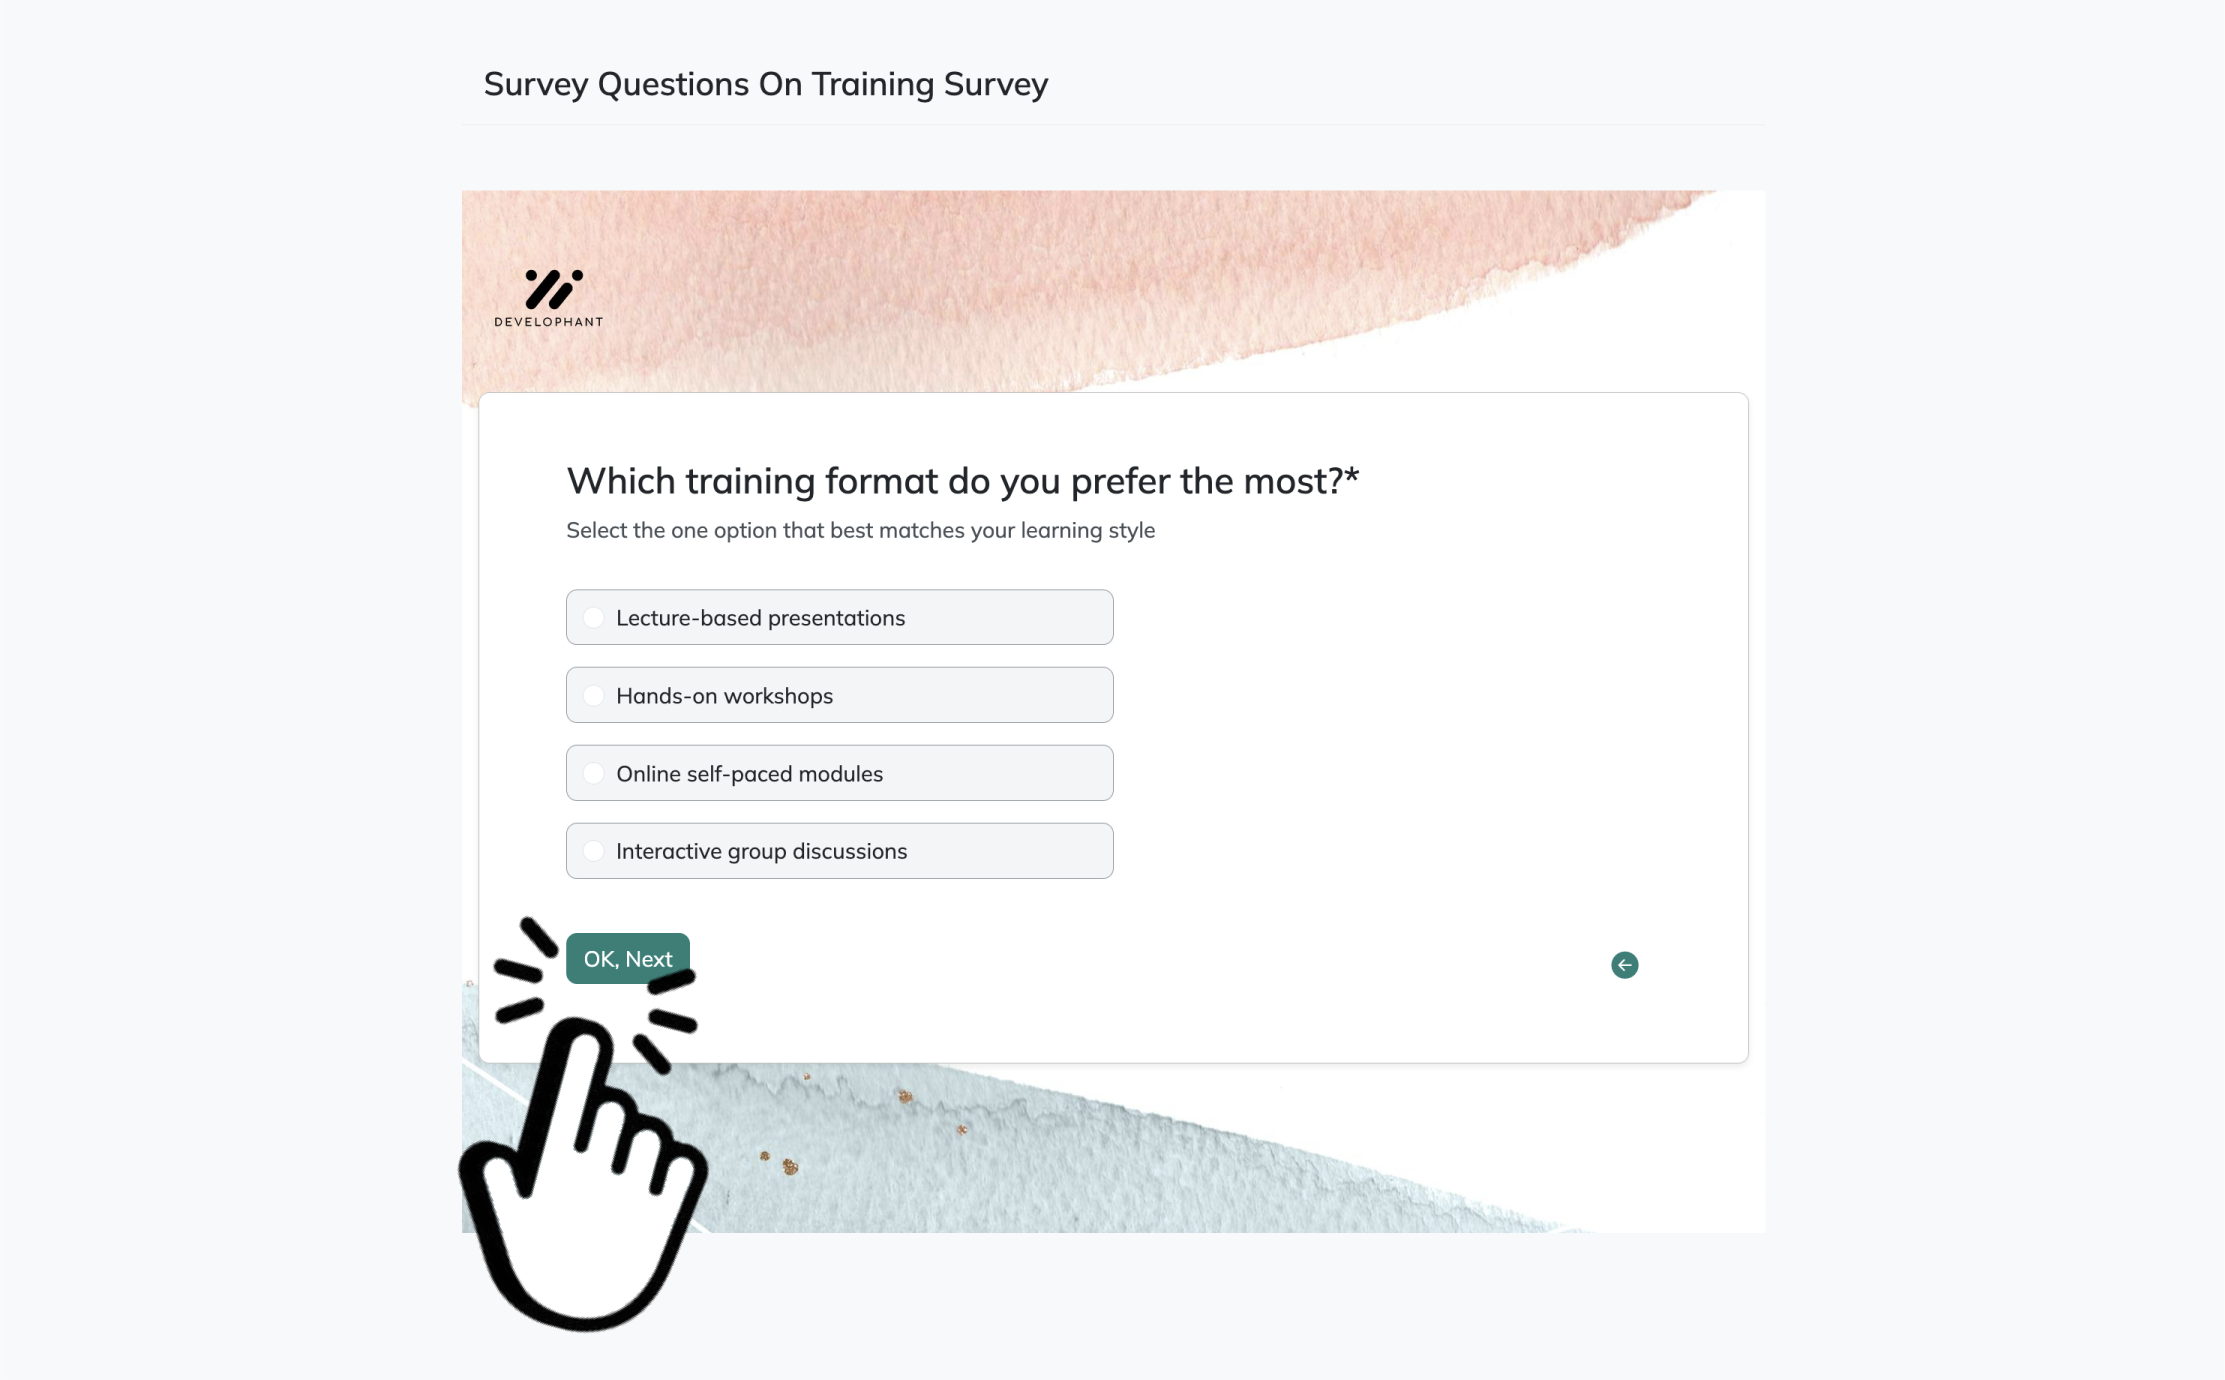
Before sharing, use Preview to check how the survey looks on desktop or mobile. When everything is ready, click Publish to get a shareable link. Send that link to your respondents and start collecting numerical answers.
Count-Based Numerical Questions
Count-based questions give you clean, practical data about what people actually do.
If you want to measure actions instead of vague impressions, this is your lane. These questions ask “how many” and usually produce whole-number answers, which makes them perfect for tracking usage frequency, purchases, support issues, visits, incidents, and even team size.
Why & When to Use
Count questions shine when you need behavior data you can act on fast. They help you spot light, medium, and heavy users without playing guessing games like a survey-themed detective.
Here’s the thing, count-based answers are often more useful than broad rating scales when you need real volume. A person saying they are “very engaged” is nice, but knowing they logged in 18 times this month is a lot more helpful.
They also support smarter survey design. If you are wondering how many questions should be in a survey, how many questions should be a questionnaire have, or how many questions in a questionnaire makes sense, count questions can do more work with fewer items.
Keep these practical tips in mind:
Define the time frame clearly, like “in the last 30 days” or “this quarter.”
Decide whether zero is a valid answer, and make that obvious.
Use counts when raw behavior matters more than opinion.
Group wide-ranging answers later into segments for easier analysis.
Sample questions
On a scale of 0 to 10, how likely are you to recommend our service?
On a scale of 1 to 5, how satisfied are you with the checkout experience?
On a scale of 1 to 7, how easy was it to find the information you needed?
On a scale of 1 to 5, how confident are you in using the new feature?
On a scale of 0 to 10, how well did our support team resolve your issue?
Research in survey methodology finds factual behavior questions are generally less prone to interviewer effects than subjective attitude questions, improving data quality (source).
Rating Scale Numerical Questions
Rating scales turn opinions into numbers you can actually compare.
These are some of the most common numerical survey question examples because they are easy for people to answer and easy for you to analyze. If you are wondering how many questions should be in a survey, how many questions should a questionnaire have, or how many questions in a questionnaire works best, rating scales help you learn a lot without making the survey feel like homework.
Why & When to Use
Use rating scale questions when you want measurable feedback about satisfaction, agreement, effort, confidence, or perceived value. They work beautifully for NPS-style recommendation, CSAT, employee morale, onboarding experience, and feature feedback.
Here’s the thing, a rating scale is not the same as an open number box. A scale question gives people fixed choices like 0 to 10 or 1 to 5, while open numeric entry is better when you need an exact number, like price, age, or quantity.
Rating scales are especially useful when you want to track trends over time or compare groups side by side. Plus, they make showing a numerical response much cleaner than asking messy open-ended opinions.
Keep these tips in play:
Define what the endpoints mean, like 0 = not at all likely and 10 = extremely likely.
Use the same scale throughout the survey when possible.
Match scale length to the precision you really need.
Use scales when measuring attitudes, not exact counts.
On top of that, if you are choosing how many questions should be in a questionnaire, scale items are efficient little overachievers.
Sample questions
How many hours per week do you spend using our platform?
How many days per month do you work remotely?
How many minutes did you wait before speaking to a representative?
How many times per week do you log in to the app?
How many days did it take to fully onboard your team?

Frequency and Time-Based Numerical Questions
These questions show you what people actually do, not just what they say they feel.
If you are figuring out how many questions should be in a survey, how many questions should a questionnaire have, or how many questions in a questionnaire makes sense, frequency and time-based items are a smart pick. They measure recurrence, duration, and intervals like times per week, days per month, minutes waited, or hours worked.
Why & When to Use
Use these questions when you want to spot habits, delays, and performance gaps. They are especially useful for app engagement, healthcare forms, employee productivity, training completion, event participation, and service delivery.
Here’s the thing, some of these can act like continuous survey questions because time and duration often vary across a wide numeric range. That makes them great for trend analysis, benchmarks, and showing a numerical response in a way that feels grounded in real behavior.
Precise recall windows matter a lot. Asking about "last week" or "the past 30 days" usually gets better answers than asking people to remember the ancient past, which is a little rude to their memory.
Keep these tips handy:
Match the unit to real life, like minutes for wait time and days for onboarding.
Avoid long recall periods that lead to fuzzy guesses.
Use caps or ranges if huge values are unlikely or suspicious.
Choose these when you need numerical questions to ask about behavior, time, or usage patterns.
Plus, if you are debating how many questions should be in a questionnaire, these often earn their spot fast.
Sample questions
What percentage of your monthly budget goes to this product category?
What percentage of your workday is spent on manual tasks?
What percentage of your customers come from referrals?
What percentage of your team has completed the required training?
What percentage of your online purchases happen on mobile devices?
Survey method research shows shorter, specific recall windows improve accuracy, with respondents recalling behaviors more reliably for recent periods like the last month than the last year (source).
Percentage and Allocation Questions
These questions help you see what gets the biggest slice of attention, time, or money.
If you are deciding how many questions should be in a survey, how many questions should a questionnaire have, or how many questions in a questionnaire feels reasonable, percentage and allocation questions can do a lot of heavy lifting. They ask people to estimate proportions, shares, or distributions, which makes them useful when you want more than a simple rank order.
Why & When to Use
Use these when you need to measure budget allocation, perceived market share, channel attribution, time use, or product mix. Plus, percentage questions often reveal priorities more clearly than rankings because they show intensity, not just position.
A strong numerical answer type questions example is share-of-time or share-of-budget. For example, asking what percentage of a workday goes to manual tasks can tell you where the real drag lives, and yes, percentages can be surprisingly good at spilling the beans.
Keep these practical notes in mind:
Say clearly if responses should total 100%.
Remember that not everyone can estimate percentages accurately.
Use ranges when exact precision is likely to be shaky.
Check that totals add up logically when required.
Choose these when you want numerical questions to ask about allocation, priorities, or showing a numerical response in a more useful way.
On top of that, if you are wondering how many questions should be in a questionnaire, these can replace several weaker questions with one sharper one.
Sample questions
How much did you spend on our products in the last 12 months?
What is your average monthly budget for this type of software?
How much money do you estimate our tool saves your team each month?
What is the maximum amount you would be willing to pay for this feature?
How much revenue does your business generate from repeat customers each quarter?
Amount, Revenue, and Value Questions
These questions turn opinions into numbers you can actually use.
If you are deciding how many questions should be in a survey, how many questions should a questionnaire have, or how many questions in a questionnaire makes sense, amount and value questions can pull serious weight. They help you measure money, savings, cost, revenue, customer lifetime value, budget, and willingness to pay without playing guessing games.
Why & When to Use
Use these when you need to quantify customer value, pain points, ROI, or pricing sensitivity. Here's the thing, if someone says a problem is "expensive," that is helpful, but if they say it costs $2,000 a month, now you have something your team can actually work with.
These questions are especially useful in SaaS, retail, finance, procurement, and B2B research. On top of that, they are great when you want numerical questions to ask that show whether a product saves money, drives repeat revenue, or deserves a bigger budget.
A few practical rules make them better:
Always include a currency label and a clear time period.
Ask for exact numbers when people are likely to know them.
Use ranges or brackets for sensitive topics like revenue or budget.
Add “prefer not to say” only when the topic truly needs it.
If you want fewer but stronger questions in a questionnaire, these often beat a bunch of vague opinion questions. Money talks, and thankfully it usually uses digits.
Sample questions
How old are you?
How many years of experience do you have in your current field?
How many people live in your household?
How many employees does your company have?
How many business locations does your organization operate?

Demographic and Firmographic Numerical Questions
These numbers help you segment responses without turning your survey into a nosy neighbor.
If you are deciding how many questions should be in a survey, how many questions should a questionnaire have, or how many questions in a questionnaire is enough, demographic and firmographic numerical questions can be incredibly useful. They give you profile data like age, household size, years of experience, company size, number of locations, and revenue bands so you can understand who is answering, not just what they think.
Why & When to Use
Use these questions when the numbers support your actual research goal. They are especially helpful for segmentation, benchmarking, and cross-tab analysis, so you can compare responses by life stage, experience level, team size, or business maturity.
Here's the thing, not every survey needs them. If a profile question does not help you interpret results or make decisions, leave it out, because nobody enjoys filling out extra boxes for sport.
Keep these practical rules in mind:
Ask only the demographic or firmographic numbers you truly need.
Use ranges instead of exact values for sensitive topics like age or annual revenue when appropriate.
Place more sensitive questions near the end of the survey.
Explain why you are asking if the question could feel personal or intrusive.
If you want fewer but smarter numerical questions to ask, these can do a lot of work in a small space. Plus, they make it easier to see patterns that would otherwise stay hidden.
Sample questions
How many questions did respondents answer before dropping off?
What was the average time needed to complete the survey?
How many numerical fields required manual data cleaning after collection?
What percentage of respondents skipped at least one numeric question?
How many survey questions are truly essential to your goal?
Best Practices for Writing Numerical Survey Questions
Think of this as your quality-control checklist for every number you ask people to type.
If you are wondering how many questions should be in a survey, how many questions should a questionnaire have, or how many questions in a questionnaire makes sense, start with one rule: fewer, clearer questions usually win. Here's the thing, the right number depends on your audience, the complexity of the topic, and whether you are sending the survey by email, mobile, or inside an app.
Your real goal is not to cram in 100 survey questions and hope for the best. It is to protect response quality, improve completion rates, and collect clean data that does not make your spreadsheet cry.
Why & When to Use
Use this checklist whenever you write, review, or trim numerical questions to ask. On top of that, it helps you decide how many questions should be in a questionnaire by focusing on what respondents can answer accurately and what you will actually analyze.
Good numerical questions are precise, answerable, and worth the effort.
Do this:
Define units like days, dollars, hours, or percentages.
Set realistic ranges and validation rules.
Use consistent scales across similar questions.
Keep recall periods specific and manageable.
Test for clarity before launch.
Ask only as many questions as needed.
Avoid this:
Mixing time frames across similar questions.
Asking for exact numbers people cannot remember.
Using vague wording like “often” when you need a number.
Stacking too many numeric fields in a row.
Requesting sensitive numbers without a clear reason.
Collecting data you will never use.
Sample questions
Which numerical responses reveal the biggest customer pain point?
Which segments report the lowest satisfaction scores?
What usage thresholds separate high-value customers from low-value customers?
Which time-based responses point to friction in the customer journey?
What financial responses suggest pricing or packaging opportunities?
How to Turn Numerical Survey Responses Into Action
This is where your survey stops being a spreadsheet and starts being useful.
If you are asking how many questions should be in a survey, how many questions should a questionnaire have, or how many questions in a questionnaire makes sense, the end goal is not more data. It is better decisions.
Here's the thing, numerical responses become powerful when you organize them into patterns you can act on. Look across customer groups, time periods, channels, and product lines so you can spot what is rising, dropping, or quietly causing chaos.
Why & When to Use
Use this step after collection when you want to turn numbers into priorities, forecasts, and next moves. Plus, it helps you see whether the number of questions in a questionnaire gave you useful insight or just extra clutter.
Action beats accumulation every time.
Focus on moves like these:
Group responses into bands such as low, medium, and high to create benchmarks.
Compare survey perceptions with behavioral counts, purchases, renewals, or usage data.
Segment results by audience type, lifecycle stage, or product line.
Look for thresholds that separate satisfied customers from frustrated ones.
Prioritize the two or three insights most likely to improve outcomes first.
On top of that, this is where numerical questions to ask really prove their value. The best numerical survey question examples do more than collect numbers. They help you build better surveys, make smarter decisions, and avoid creating 100 survey questions that just sit there looking busy.

Related Question Design Surveys

29 Quantitative Survey Research Questions Examples
Explore 25 sample quantitative survey research questions and survey questions example to guide re...
31 Good Survey Questions for Better Feedback
Explore 25 good survey questions to boost response quality, gather insights, and improve feedback...
29 Survey Questions Mistakes
Discover 25 survey questions mistakes with sample questions and expert tips to improve responses,...