29 Frequency Scale Survey Questions
Discover 25 sample questions for keyword frequency scale survey questions, with clear examples to help improve your survey design and analysis.
If you want clearer survey data, frequency scale questions are a smart place to start. They measure how often something happens, unlike satisfaction or agreement scales, and show up in customer feedback, employee engagement, product research, healthcare, education, and market research.
Plus, whether you call it a frequency scale, scale of frequency, frequency rating scale, or frequency scale questionnaire, this how often questions survey guide will walk you through choices for how often questions, key frequency scales, sample how often survey question formats, and how to turn answers into action with an online survey maker.
What Are Frequency Scale Survey Questions?
Sample questions
How often do you use this product in a typical week?
How often do you encounter this issue during checkout?
How often do you contact customer support?
How often do you recommend our service to others?
How often do you complete this task on time?
Frequency scale questions measure repeat behavior.
A frequency scale helps you track how often something happens over time, not just how someone feels about it. In a how often questions survey, you are measuring recurrence, habits, and patterns that can actually point to action.
Here’s the thing: “I like this product” and “I use this product every day” are not the same insight. One is sentiment, while the other is behavior, and behavior usually spills the beans faster.
Why & When to Use
Use a frequency scale when you want clear data on repeated actions, events, or experiences. This is the foundation of choices for how often questions, because it tells you whether to ask about actual behavior or a looser perception.
Common answer formats include verbal options like Never, Rarely, Sometimes, Often, Always. You can also use time-based choices such as Daily, Weekly, or Monthly when the recall period is specific.
Use verbal frequency scales when you want simple, fast answers.
Use numeric or timeframe-based options when precision matters more.
Use short recall periods when possible, because memory gets fuzzy fast.
Make how often multiple choice questions mutually exclusive, easy to scan, and easy to interpret.
For example, a frequency scale survey might ask: “How often do you use the app?” with Never, Rarely, Sometimes, Often, Always. On top of that, if you need exact reporting, a how often survey question like “How many times per week?” may work better.
Research shows behavioral frequency questions are more accurate with short, specific recall periods because longer timeframes increase memory error and inference-based reporting (source).
Here’s how to create a frequency scale survey in HeySurvey in 3 easy steps:
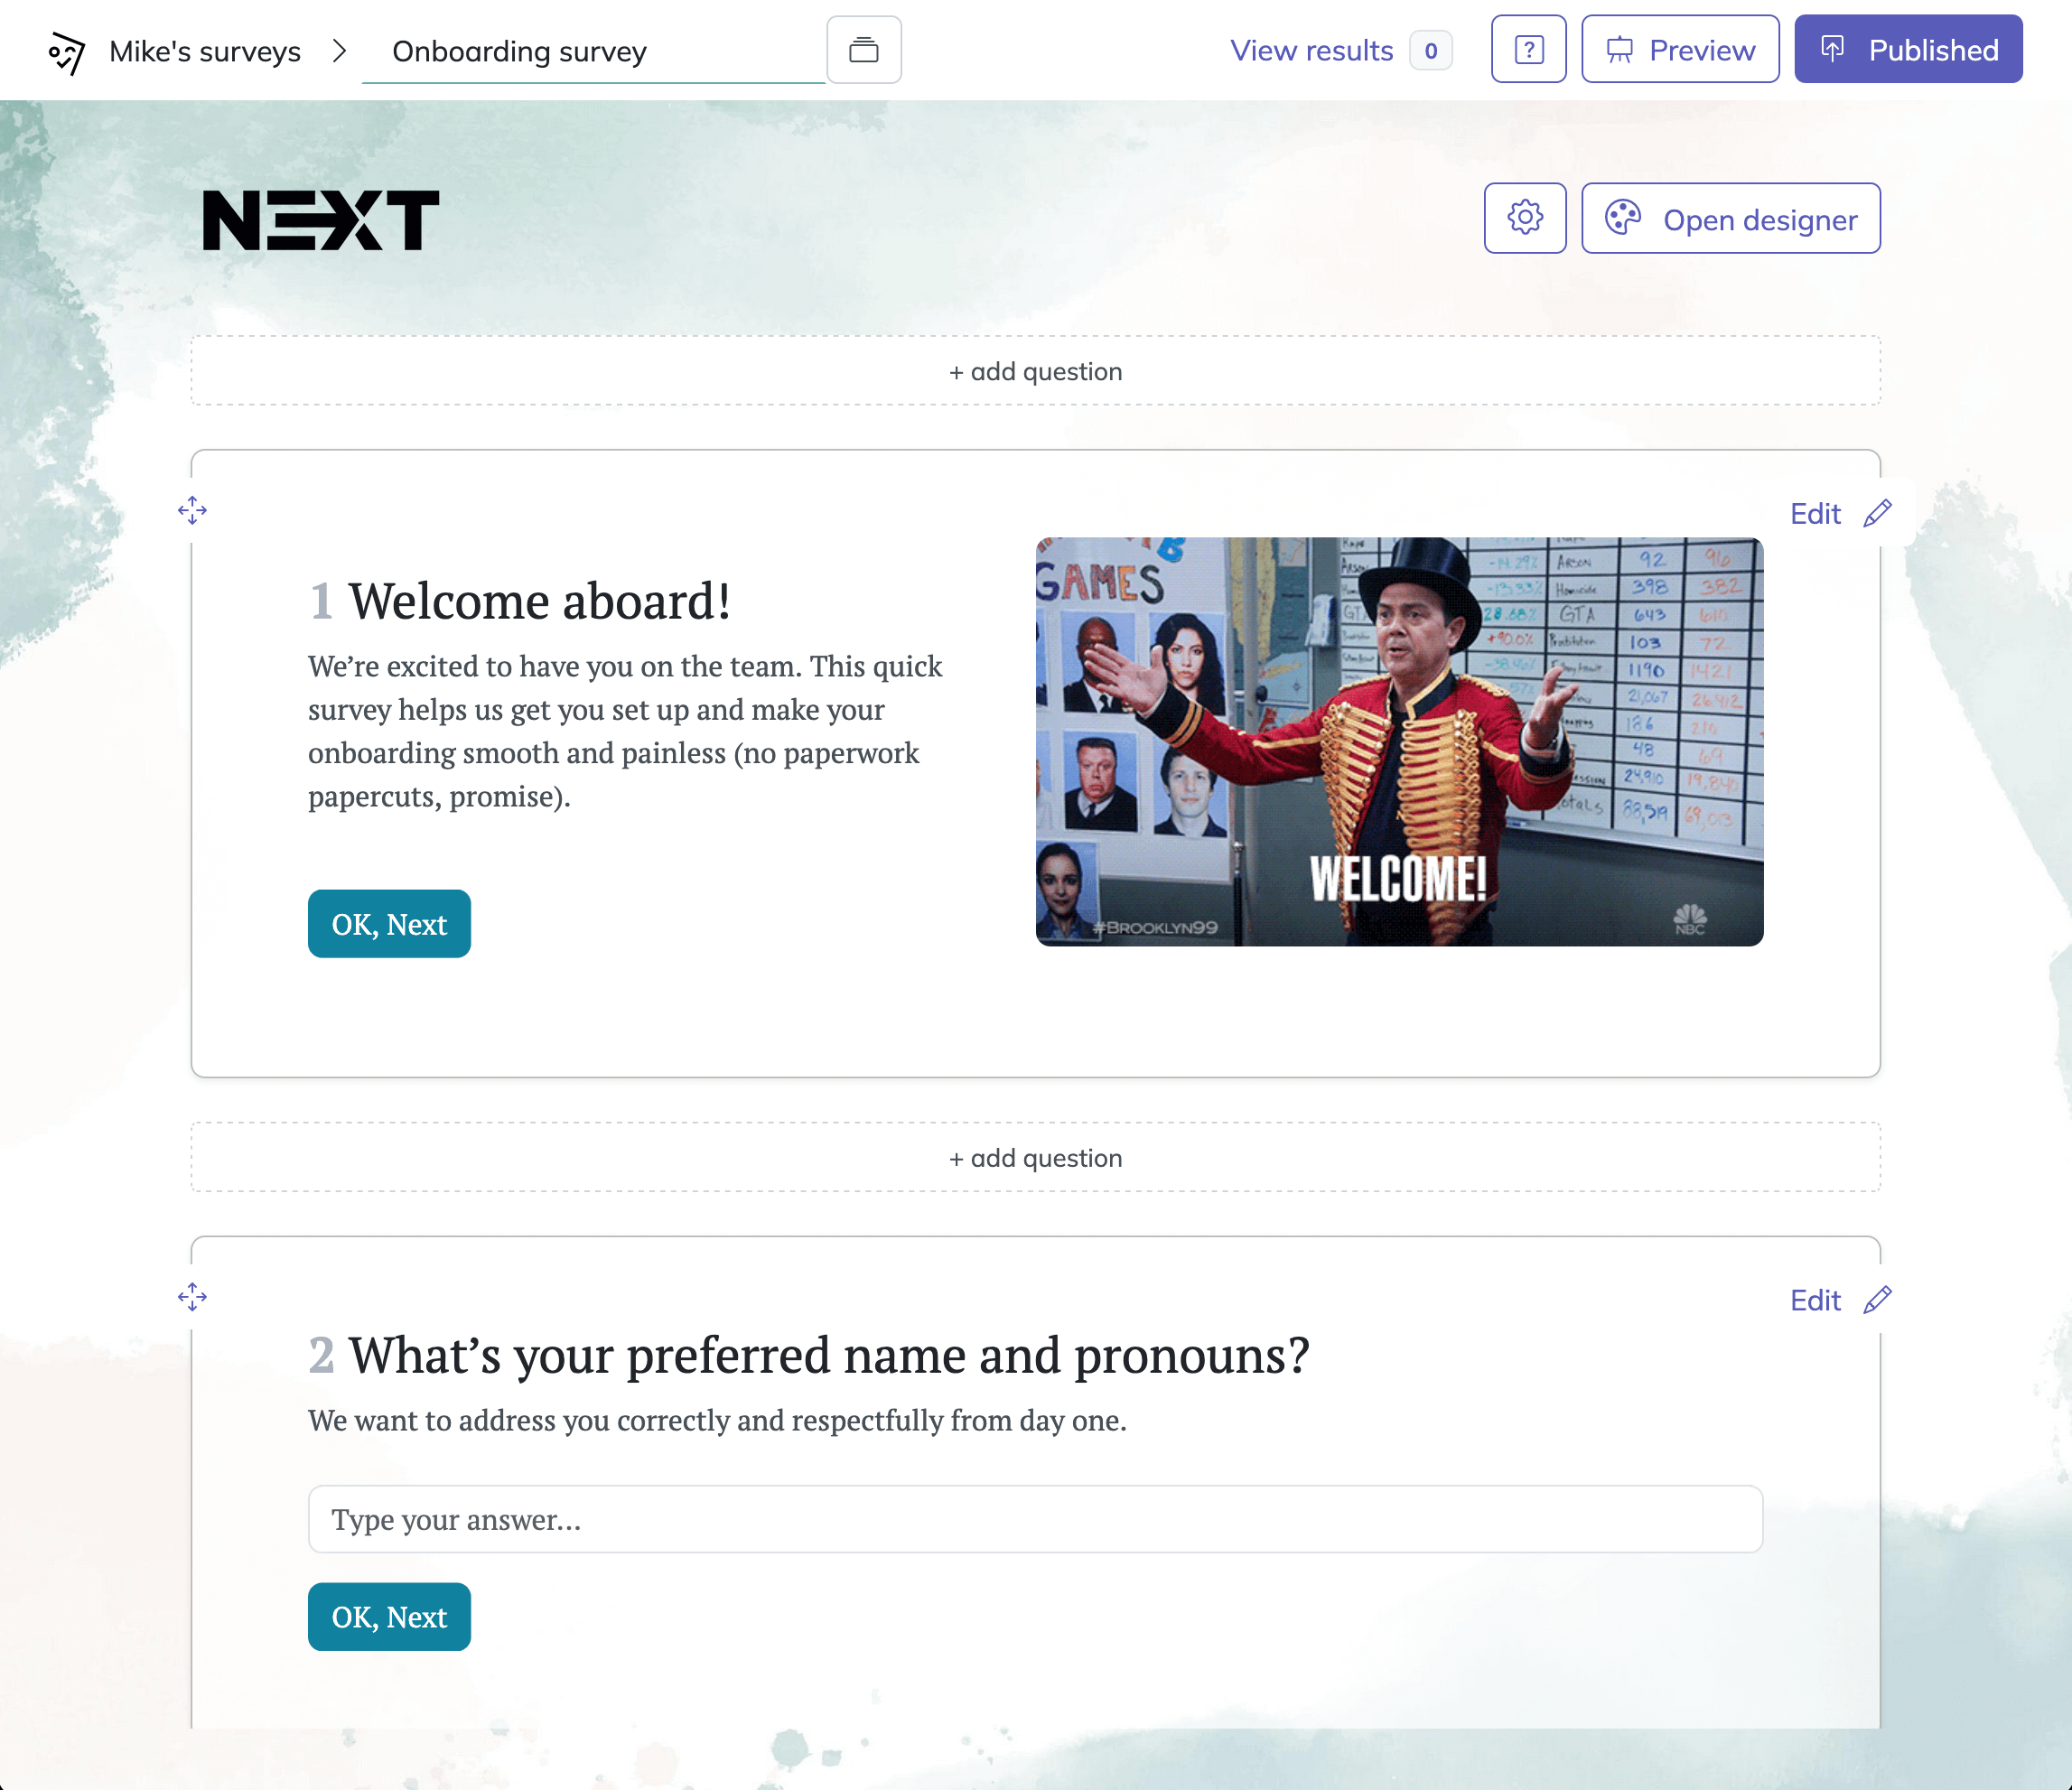
1. Create a new survey
Start by clicking the button below to open a template, or choose a blank survey if you want to build one from scratch with our online survey tool. Once the survey editor opens, you can give your survey a name and adjust basic settings. You do not need an account to begin creating, but you will need one to publish the survey and view responses later.
2. Add questions
Click Add Question to insert a new question. For frequency scale surveys, select a Scale question type. Then enter your question, such as “How often do you use this feature?” and set the scale range and labels, like “Never” to “Always.” You can mark the question as required if needed, and add more scale questions the same way.
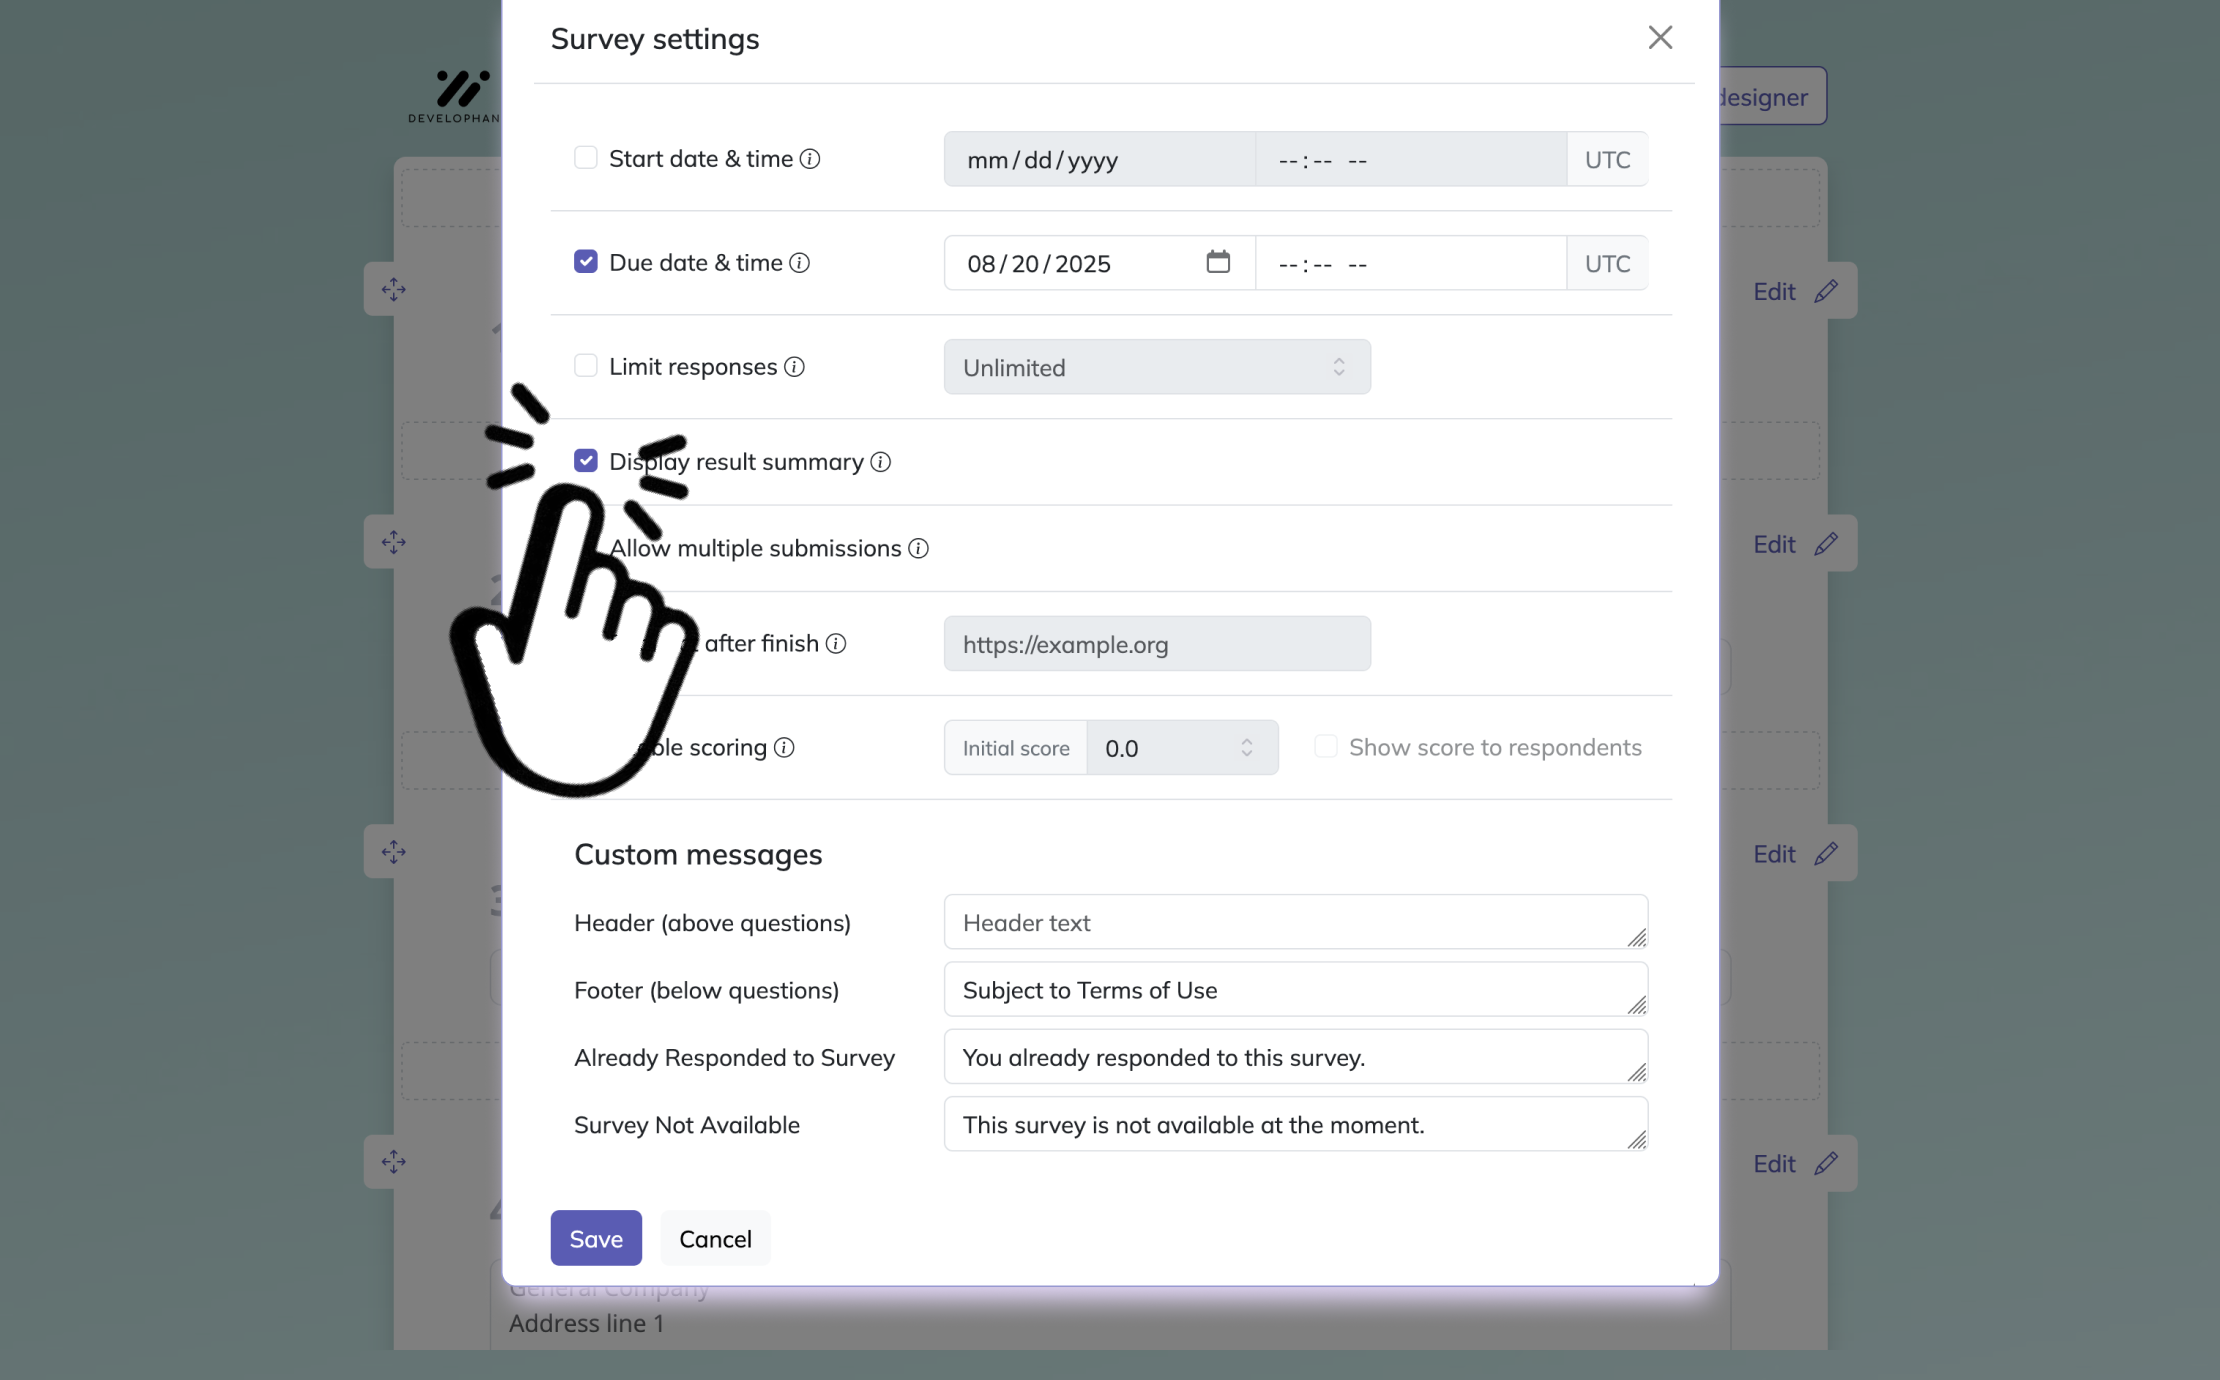
3. Publish survey
Before publishing, preview your survey to make sure everything looks right. When you’re ready, click Publish to get a shareable link. You can then send it to respondents and start collecting answers.
Customer Satisfaction and Experience Frequency Questions
Sample questions
How often do you experience delays when receiving your order?
How often do you find the information you need on our website?
How often do you contact our support team after making a purchase?
How often do you encounter problems when using our product?
How often do you buy from our brand compared with competitors?
Recurring experience data shows you where customer frustration keeps showing up.
A frequency scale is especially useful when you want to measure customer experience across the full journey, not just capture one mood in one moment. In a how often questions survey, you can spot repeat issues in support, product friction, delivery, repurchase behavior, and brand engagement.
Here’s the thing: a single satisfaction score can tell you a customer is unhappy, but it will not always tell you how often the problem happens. That is where frequency scales earn their coffee.
Why & When to Use
Use a frequency scale survey when you need to track recurring pain points over time and see whether they are improving, spreading, or quietly causing churn. Plus, these choices for how often questions help you find patterns that a one-time rating can easily miss.
To make your how often multiple choice questions more useful:
Match the scale of frequency to the journey stage, such as browsing, buying, delivery, or support.
Compare results by segment, like new customers, repeat buyers, or high-value accounts.
Use follow-up open text only when needed, especially after “Often” or “Always” responses.
Review trends over time to support churn reduction and service improvement.
On top of that, a smart frequency rating scale helps you fix what keeps happening, not just what happened once.
Vague frequency labels like “sometimes” and “often” are interpreted differently across respondent groups, risking biased comparisons in frequency-scale surveys (source).
Product Usage and Feature Adoption Frequency Questions
Sample questions
How often do you log in to the platform?
How often do you use the reporting dashboard?
How often do you use this feature to complete your work?
How often do you abandon a task before finishing it in the app?
How often do you use an alternative tool instead of this product?
Usage patterns reveal whether your product is becoming a habit or just visiting occasionally.
A frequency scale works brilliantly when you want to measure how often people use a product, feature, tool, or workflow in real life. In a how often questions survey, you can learn whether usage is steady, growing, occasional, or dropping off before anyone sounds the alarm.
Here’s the thing: product teams often look at raw activity data, but a frequency scale questionnaire adds context that analytics alone can miss. It helps you understand adoption, stickiness, and habitual use across SaaS tools, mobile apps, subscriptions, and digital platforms, which is very handy when your dashboard is trying to say ten things at once.
Why & When to Use
Use this type of how often survey question when you want to see how regularly people return, which features fit into their routine, and where usage breaks down. Plus, these choices for how often questions help you separate core behaviors from nice-to-have actions.
To make your frequency scales more useful:
Match the answer options to realistic usage cadence.
For product habits, use choices like Daily, Weekly, or Monthly instead of fuzzy labels.
Pair frequency data with satisfaction or importance ratings for smarter prioritization.
Remember that low frequency does not always mean low value, because some features are built for occasional use.
On top of that, a well-built frequency scale survey helps you find what users actually do, not just what they swear they do while blinking innocently.
Employee Engagement and Workplace Frequency Questions
Sample questions
How often do you receive helpful feedback from your manager?
How often do you feel overwhelmed by your workload?
How often do you collaborate effectively with your team?
How often do you feel recognized for your contributions?
How often do work processes slow you down?
A frequency scale helps you spot workplace patterns before they turn into people problems.
A how often questions survey is especially useful at work because it measures repeat experiences, not just broad opinions. Instead of asking whether employees are happy in general, you can use a frequency scale survey to learn how often support, friction, stress, and recognition actually show up in daily work life.
Here’s the thing: one bad day does not equal a broken culture, and one good day does not mean everything is sunshine and free bagels. Frequency scales help you track patterns in manager communication, collaboration, workload strain, process delays, and early burnout indicators with much better clarity.
Why & When to Use
Use these choices for how often questions in pulse surveys, engagement studies, and employee experience programs when you want to track recurring patterns over time. Plus, a scale of frequency makes it easier to compare teams, roles, tenure groups, or departments without relying on vague impressions.
To make your frequency scale questions stronger:
Use neutral wording so people do not feel blamed or pushed into defensive answers.
Keep the recall window short, like the past week or past month.
Separate positive and negative behaviors instead of squeezing both into one item.
Benchmark results by department, tenure, or role to find meaningful differences.
On top of that, how often multiple choice questions work best when employees feel safe answering honestly, because fear is a terrible co-worker.
Research shows frequency-based response formats can change conclusions about burnout and engagement measurement, so scale choice materially affects workplace survey results (MDPI).
Healthcare, Wellness, and Patient Frequency Questions
Sample questions
How often have you experienced headaches in the past two weeks?
How often do you miss a prescribed dose of medication?
How often do you exercise for at least 30 minutes?
How often do you wake up during the night?
How often do you feel stressed during a typical week?
A well-built frequency scale turns fuzzy health experiences into clearer, more useful patterns.
In healthcare, wellness, therapy, and patient feedback, a how often questions survey helps you measure what happens repeatedly, not just what feels memorable in the moment. That makes frequency scales especially useful for symptoms, medication adherence, exercise habits, sleep disruptions, stress, and care interactions.
Here’s the thing: in health research, wording matters a lot because "often" can mean wildly different things from one person to the next. Plus, if your timeframe is unclear, your data can get messy fast, which is not exactly a wellness goal.
Why & When to Use
Use these choices for how often questions when you need a practical way to track recurring behaviors or symptoms over time. A good frequency scale survey works well for patient intake forms, therapy check-ins, wellness assessments, follow-up questionnaires, and care experience feedback.
To make your frequency scale stronger:
Use clearly defined timeframes like past 7 days, past 2 weeks, or past 30 days.
Measure symptom frequency and symptom severity separately whenever possible.
Avoid vague labels in your scale of frequency if patients may interpret them differently.
Choose language that is accessible, culturally neutral, and easy to answer under stress.
Make sure the frequency scale is clinically appropriate and simple enough for respondents to recall without guesswork.
Education and Student Feedback Frequency Questions
Sample questions
How often do you participate in class discussions?
How often do you complete assignments on time?
How often do you use the course materials provided?
How often do you ask for help when you do not understand a topic?
How often do technical issues interrupt your learning?
A smart frequency scale helps you spot real learning patterns, not just overall vibes.
In education, a how often questions survey gives you a clearer view of recurring study behaviors, support needs, and classroom experiences. That makes a frequency scale especially useful when you want to understand what students actually do, not just whether they say they are "satisfied."
Here’s the thing: broad feedback questions can miss the small habits that shape performance. A student may like a course overall but still rarely use materials, avoid asking for help, or get derailed by tech issues like a Wi-Fi gremlin.
Why & When to Use
Use frequency scales when you need practical data on behaviors that happen again and again across a class, course, or program. They work well in course evaluations, student engagement surveys, training feedback, and online learning programs where patterns matter more than one-off opinions.
Plus, choices for how often questions can uncover study habits and barriers to participation better than broad satisfaction items alone.
To make your frequency scale survey more useful:
Use age-appropriate, context-specific wording students can understand quickly.
Add examples when behaviors could be interpreted differently.
Compare self-reported answers with actual engagement data when available.
Keep academic behavior questions separate from emotional wellbeing questions.
Choose clear how often multiple choice questions that fit the learning setting.
Best Practices for Writing Frequency Scale Survey Questions
Sample questions
How often do you use this service in a typical month?
How often do you experience this problem during a normal week?
How often do you interact with our emails?
How often do you need help completing this task?
How often do you return to this website after your first visit?
A strong frequency scale turns fuzzy habits into clean, comparable data.
If you are building a how often questions survey, this section works like a practical checklist you can actually use. Here’s the thing: even good questions can produce messy results when the frequency scale, wording, or how often answer options are poorly designed.
Best practices matter because bad scale choices create unreliable data that is tough to compare across questions, audiences, or time periods. On top of that, a shaky frequency rating scale can make "Often" mean one thing to you and something totally different to your respondents, which is not exactly a dream data situation.
Why & When to Use
Use these best practices whenever you are writing or reviewing frequency scales for surveys, forms, feedback tools, or research. They are especially helpful when you need a verbal frequency scale, a verbal frequency scale example, or clear choices for how often questions that match real behavior.
Dos
Define a clear timeframe when recall matters.
Use answer choices that match the real behavior frequency.
Keep the scale consistent across related questions.
Test whether labels like “Often” and “Rarely” mean the same thing to respondents.
Choose between verbal and numeric frequency scales based on your audience and use case.
Don’ts
Don’t mix frequency with agreement or satisfaction in one item.
Don’t use overlapping how often multiple choice questions or answer ranges.
Don’t ask about behaviors people cannot accurately remember.
Don’t make the scale of frequency too long unless extra precision truly helps.
Don’t switch scale direction or wording from one question to the next.
Common Mistakes and Weak Frequency Scale Examples
Sample questions
How often do you use and enjoy our app?
How often do you usually sometimes contact support?
How often are you satisfied with our product?
How often do you face problems regularly?
How often do you shop here: Never, Sometimes, Frequently, Every day, Monthly?
Weak frequency scales can make your survey look fine while quietly wrecking your data.
If you are reviewing a how often questions survey, this section helps you catch bad wording before it goes live and starts causing chaos in a very polite spreadsheet. Here’s the thing: flawed frequency scale design can turn useful feedback into misleading patterns and shaky decisions.
Why & When to Use
Use this when you want to spot broken choices for how often questions before launch. It is especially useful for fixing vague wording, missing timeframes, double-barreled items, and messy answer labels in a frequency scale survey.
Bad example vs. better version:
How often do you use and enjoy our app?
Wrong because it asks about two things.
Better: How often do you use our app in a typical week?How often do you usually sometimes contact support?
Wrong because the wording is cluttered and confusing.
Better: How often do you contact support in a typical month?How often are you satisfied with our product?
Wrong because satisfaction is not a frequency behavior.
Better: How often do you use our product in a typical week?How often do you face problems regularly?
Wrong because "how often" and "regularly" overlap.
Better: How often do you experience problems while using the product?How often do you shop here: Never, Sometimes, Frequently, Every day, Monthly?
Wrong because the labels are inconsistent and out of order.
Better: Never, Monthly, Weekly, Daily
Plus, consistent frequency scales make analysis much easier, because your data should not need detective work.
Sample questions
How often do customers report the same checkout issue?
How often do users return to a key feature after first use?
How often do employees experience process bottlenecks?
How often do patients miss follow-up care steps?
How often do students disengage during online lessons?
How to Analyze Frequency Survey Results and Turn Insights Into Action
Good survey data should do more than sit there looking organized.
Once your how often questions survey is complete, this is the moment where the real value shows up. Here’s the thing: the goal is not just to measure behavior with a frequency scale, but to use those patterns to improve outcomes in customer experience, product adoption, employee workflows, healthcare follow-through, or education performance.
Why & When to Use
Use this step after collecting responses from any frequency scale survey so you can spot what needs attention first. Plus, it helps you find high-frequency pain points, low-frequency adoption issues, and meaningful shifts over time without staring at spreadsheets until your coffee gets nervous.
A practical way to review choices for how often questions is to turn detailed responses into simple action bands like low, medium, and high frequency.
Then look deeper with comparisons such as:
by customer segment, role, plan type, or behavior cohort
by outcome metrics like retention, satisfaction, completion, or performance
by time period to see whether frequency scales are improving or slipping
On top of that, prioritize what to fix based on both frequency and impact. A problem that happens often and hurts key outcomes deserves fast action, while a low-frequency issue may need monitoring instead of a full rescue mission.
The big takeaway is simple: the best frequency scale questions do not just give you cleaner data. They give you better decisions.
Related Question Design Surveys
29 Quantitative Survey Research Questions Examples
Explore 25 sample quantitative survey research questions and survey questions example to guide re...
31 Good Survey Questions for Better Feedback
Explore 25 good survey questions to boost response quality, gather insights, and improve feedback...
29 Survey Questions Mistakes
Discover 25 survey questions mistakes with sample questions and expert tips to improve responses,...