31 Disadvantages of Closed-Ended Survey Questions
Explore 25 sample questions on disadvantages of closed ended survey questions, with clear examples, insights, and practical survey tips.
You see closed ended survey questions everywhere because they are quick to answer, easy to compare, and perfect for research, customer feedback, employee surveys, and market research. A closed questionnaire, close ended questionnaire, or closed-ended questionnaire can speed things up nicely, but here’s the thing: closed ended questions in research can also limit insight, steer responses, and flatten nuance. This guide shows you the biggest drawbacks, where each closed questionnaire example tends to trip people up, and how to design smarter surveys without accidentally putting your insights in a tiny box using an online survey tool.
What Are Closed Ended Survey Questions?
Sample questions
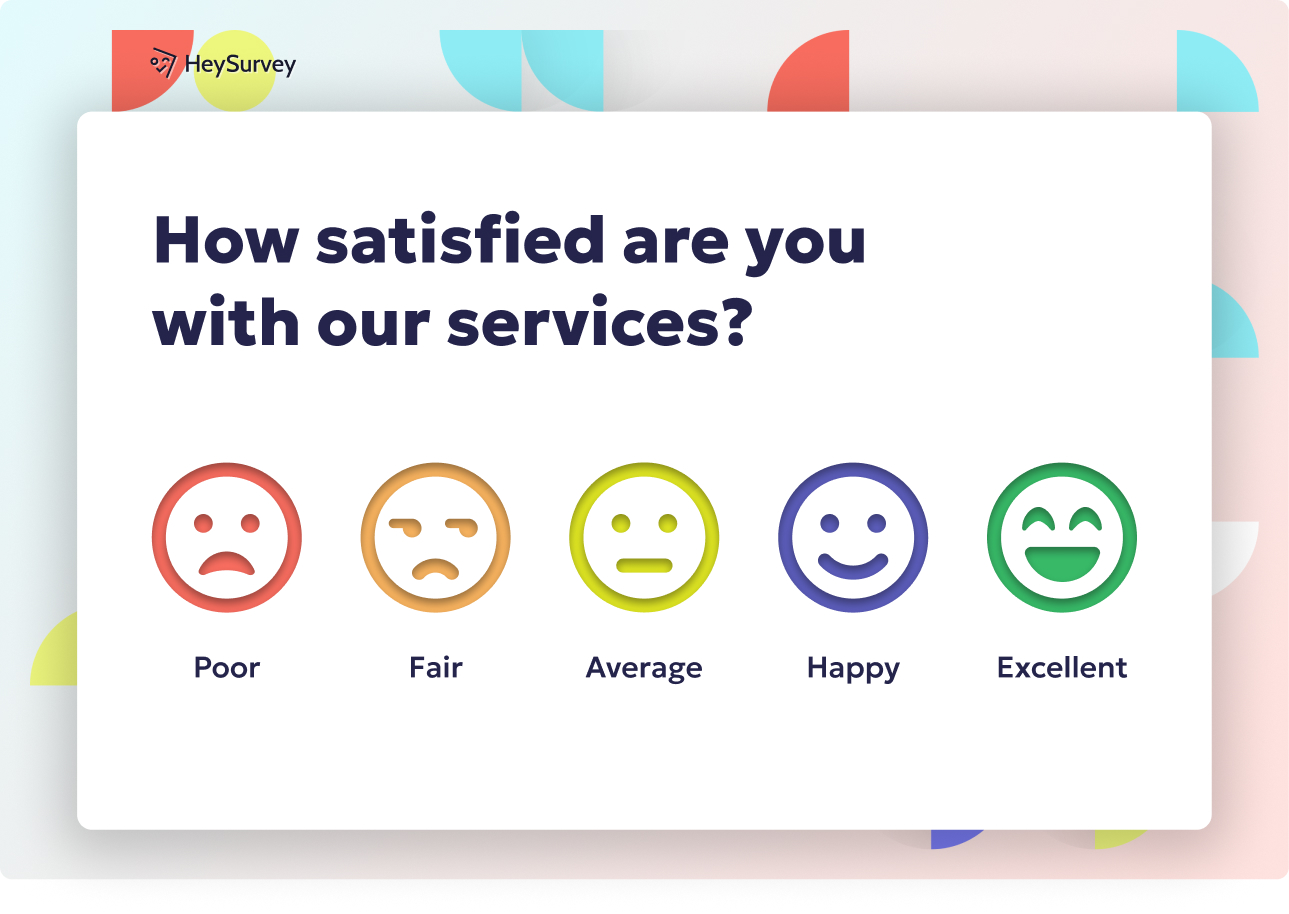
How satisfied are you with our service?
Did our product meet your expectations?
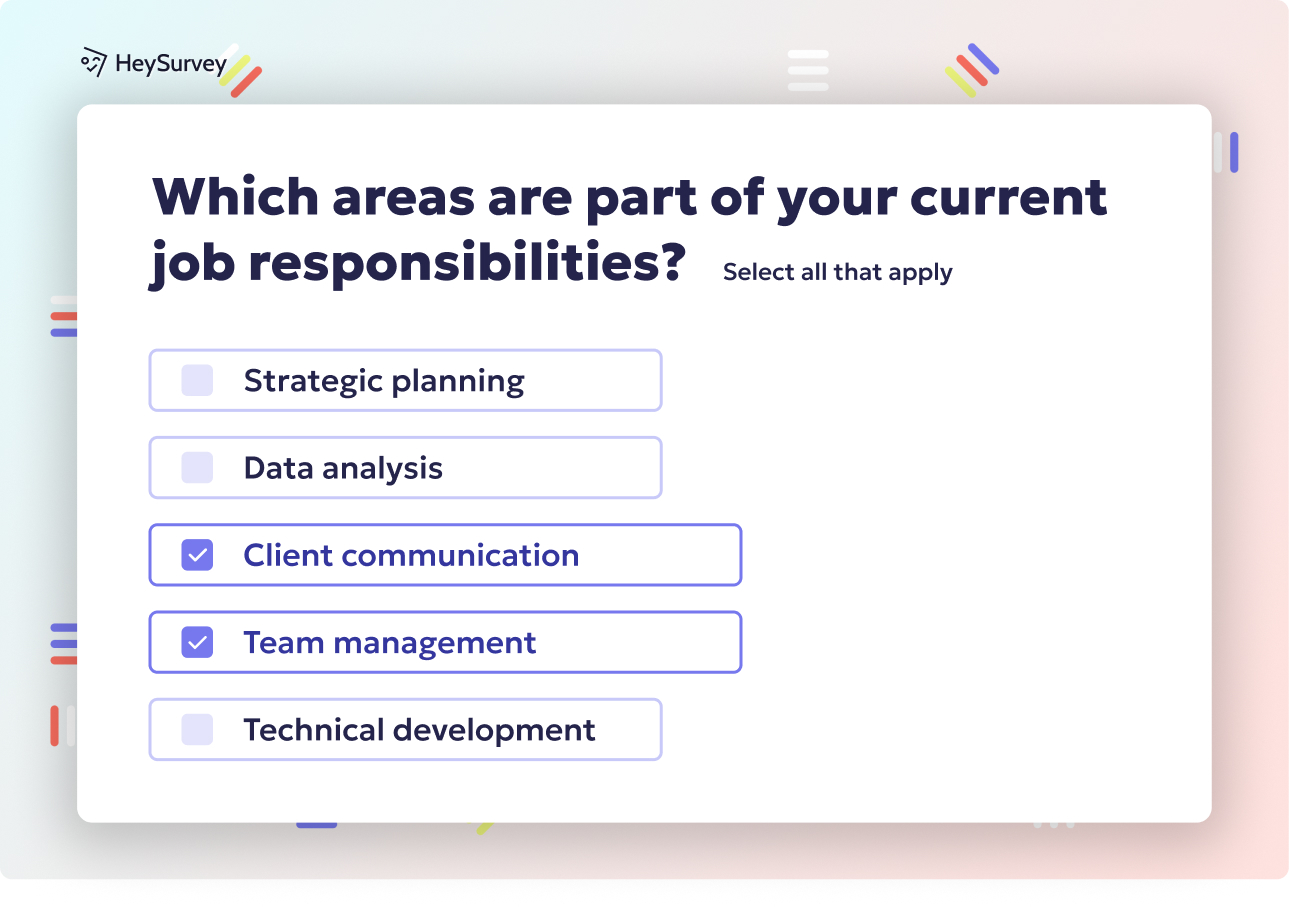
Which feature do you use most often?
How likely are you to recommend us to a friend?
How often do you purchase from our brand?
Closed ended survey questions give people preset answers to choose from, instead of asking them to write whatever they want.
That is the core idea behind a closed questionnaire or close ended questionnaire.
You give answer options, and your respondent picks the one that fits best.
Open ended questions do the opposite.
They invite people to answer in their own words, which can uncover richer detail but takes more time to review, and yes, your spreadsheet may start sweating a little.
Common close ended survey questions include:
Yes or no questions
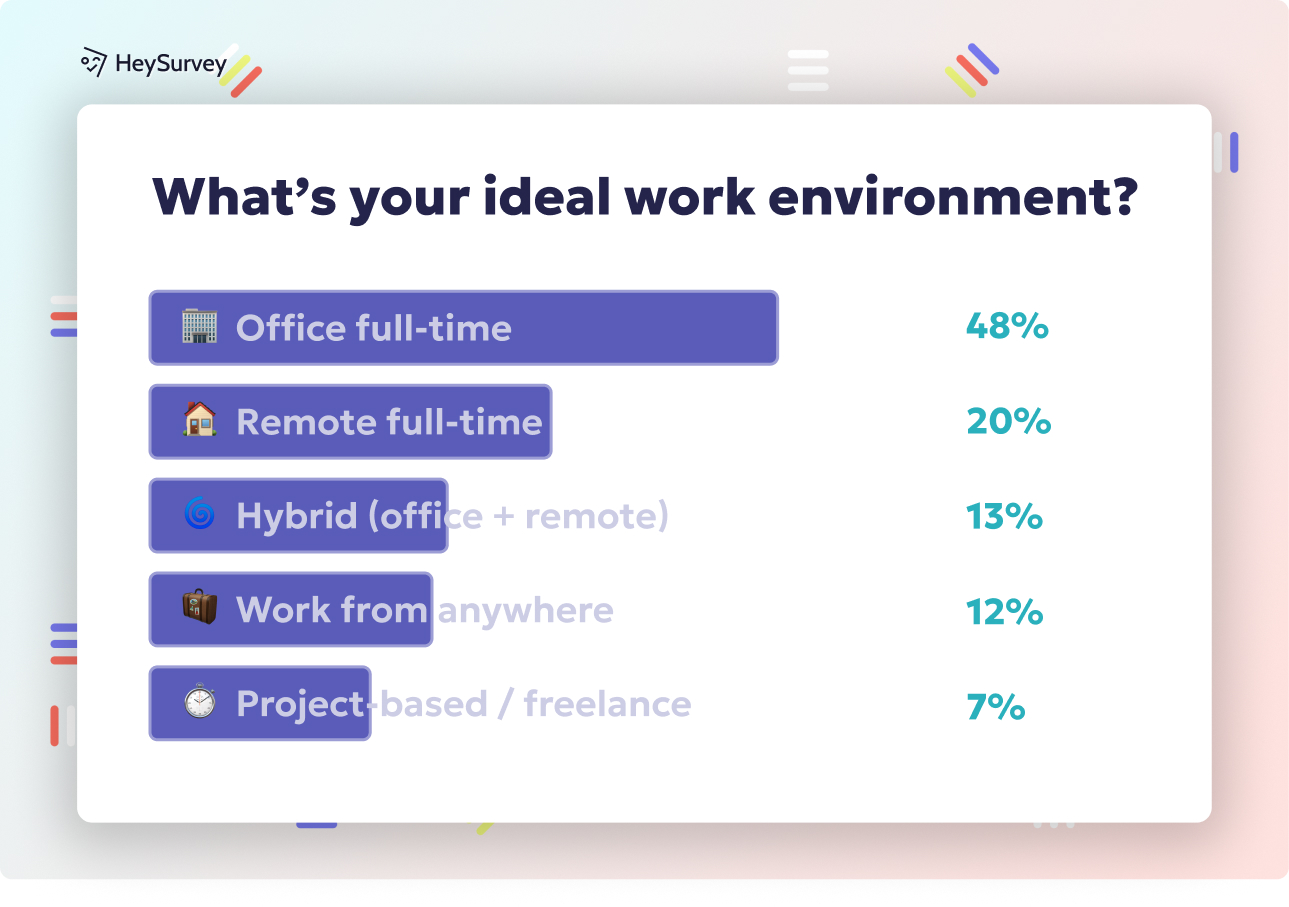
Multiple choice questions
Rating scale questions
Likert scale questions
Ranking questions
Checklist questions
You will see these formats in almost every closed-ended questionnaire because they are easy to answer and simple to compare.
A closed ended questionnaire example might ask customers to rate service from 1 to 5, choose their favorite feature, or say how often they buy from you.
Plus, these closed ended survey questions examples help beginners quickly spot the difference between structured response options and free-text feedback.
Why & When to Use
This section gives you the basics before you dig into the downsides.
Closed ended questions work best when you need:
Large sample sizes
Quantitative analysis
Trend tracking over time
Benchmarking across groups
Fast survey completion
Here’s the thing: a close ended questionnaire is most useful when consistency matters, especially in research, customer feedback, and recurring surveys.
Closed-ended questions can miss unanticipated answers because respondents must choose from researcher-defined categories, limiting nuance and potentially forcing invalid responses (source).
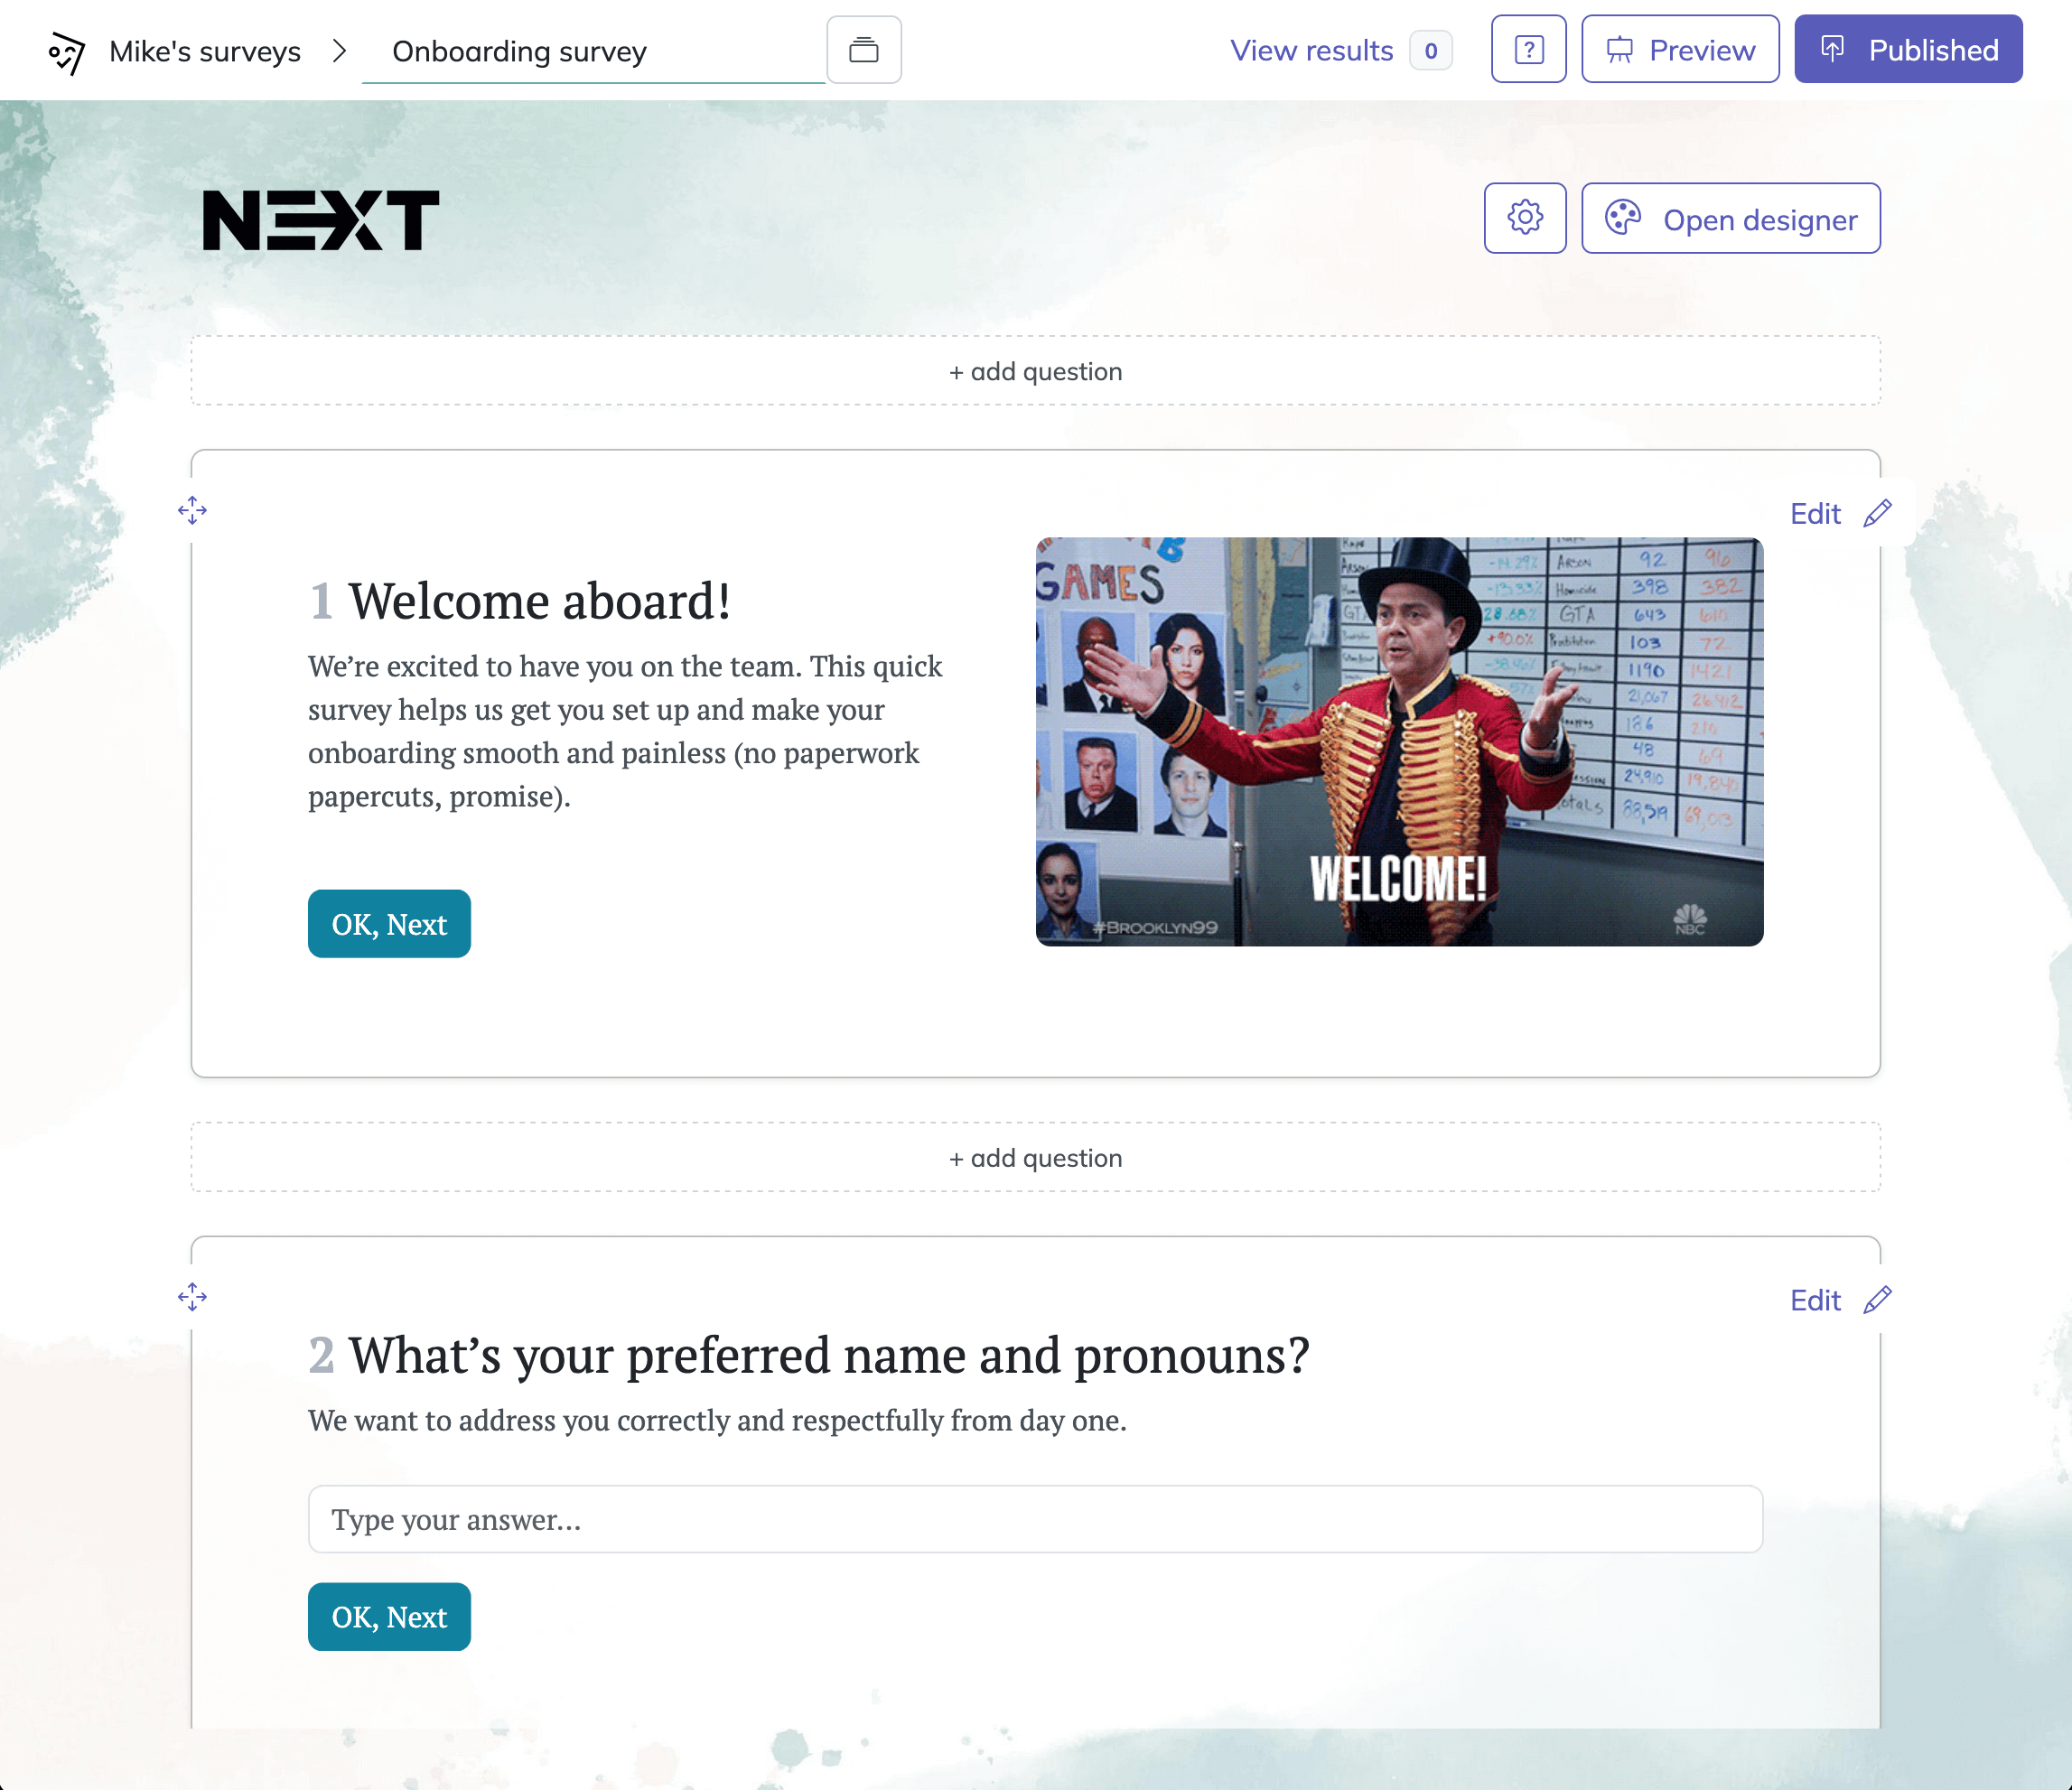
Create a survey about the disadvantages of closed-ended survey questions in 3 easy steps:
Create a new survey
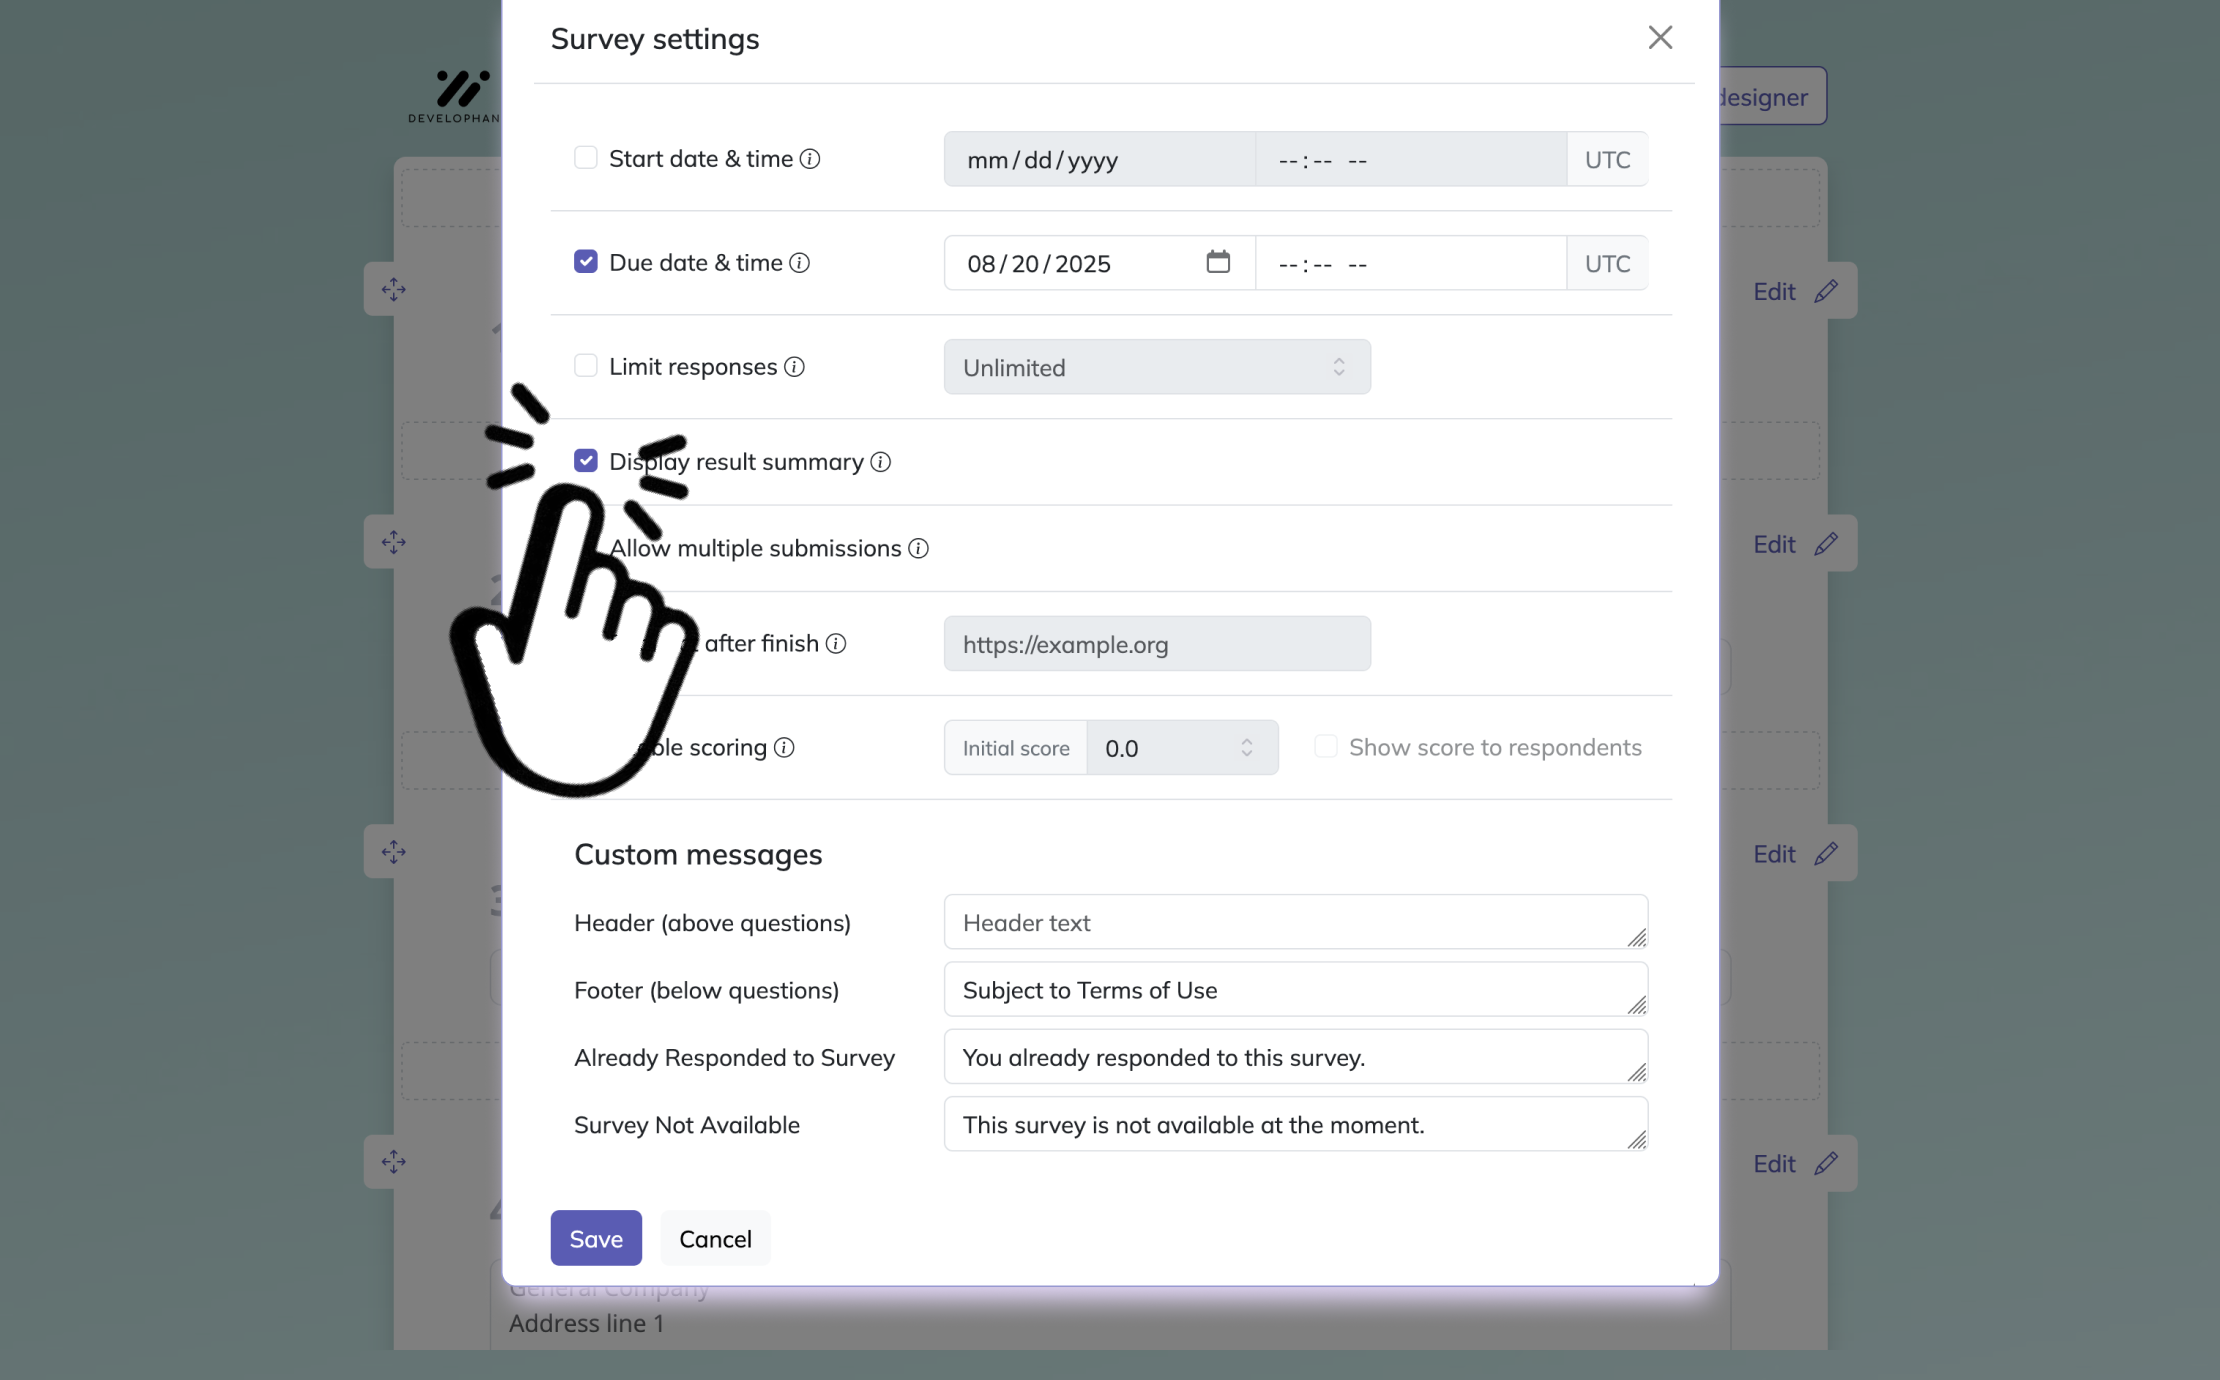
Start by opening a template with the button below, or begin from scratch in HeySurvey, an online survey maker. Give your survey a clear name so you can find it later. If you want, add your logo and adjust basic settings like survey dates or response limits.Add questions
Click Add Question and choose the question type that fits your survey. For this topic, use Choice or Scale questions to ask about problems like limited answer options, lack of detail, or missed opinions. You can also add a Text question so respondents can explain their thoughts in their own words.Publish your survey
Review your survey with Preview to make sure everything looks right. When you are ready, click Publish to create a shareable link. Then send it to your audience and start collecting responses.
Limited Depth: They Don’t Capture the Full Story
Sample questions
Did you find the checkout process easy?
How satisfied are you with the support you received?
Was the issue resolved on the first contact?
Which of these reasons best explains your cancellation?
How clear was the pricing information?
A closed questionnaire is great at measuring answers, but not always great at uncovering the reasons behind them.
That is the biggest drawback of a close ended questionnaire.
Your respondent has to squeeze their real opinion into the answer choices you gave them, even when none of those choices feel quite right.
As a result, close ended survey questions can miss the why behind the click.
They often hide motivations, emotions, unusual situations, and the kind of unexpected feedback that makes you pause and say, "Well, that escalated quickly."
A closed ended questionnaire sample may show that someone was dissatisfied, but it may not reveal whether the problem was price, timing, tone, confusion, or something you never thought to ask about.
Here’s the thing: open ended questions have the opposite problem.
They can uncover context and detail, but they are slower and messier to analyze, while a closed-ended questionnaire is easier to score but more likely to miss the full story.
Respondents may feel forced into imperfect choices
Important edge cases can get buried
Emotional nuance is easy to lose
New insights rarely appear unless you planned for them
Why & When to Use
Close ended survey questions still work well when your goal is measurement, not discovery.
They are best when the topic is already familiar, the likely responses are known in advance, and you want clean data fast.
Plus, if nuance matters, add a short open text follow-up after your closed questionnaire example so people can explain anything your answer options missed.
Closed-ended survey questions can steer respondents toward researcher-defined options, limiting unanticipated answers and obscuring underlying motivations and context. Source
Response Bias: Answer Choices Can Shape Results
Sample questions
How helpful was our excellent customer service team?
Do you agree that our new pricing is fair?
Which of these benefits do you value most?
How would you rate your experience today?
Did our updated platform improve your workflow?
A closed questionnaire can look objective on the surface, but the wording of the answers can quietly steer people like a shopping cart with one wonky wheel.
That is where response bias sneaks into a close ended questionnaire.
If your question sounds leading, your scale feels uneven, or your answer list leaves out obvious choices, people may respond to your framing instead of their real opinion.
A lot of close ended survey questions go off track because of survey design, not because the format itself is flawed.
For example, acquiescence bias makes people more likely to agree with a statement, especially when the question is phrased as "Do you agree."
Central tendency bias can also flatten results when respondents keep picking the middle option just to play it safe.
On top of that, poorly balanced scales can push answers in one direction.
Leading wording can make one response sound smarter or safer
Incomplete answer lists can force people into the "closest" option
Central-heavy scales can attract fence-sitters
Unbalanced choices can tilt results without you noticing
Why & When to Use
A close ended questionnaire still works well when you can create neutral, exhaustive, and mutually exclusive answer choices.
It is especially useful in recurring surveys where consistency matters more than exploration.
Plus, a closed ended questionnaire sample should always be pilot tested before launch.
Review every option for hidden bias, check whether the scale feels balanced, and make sure your closed questionnaire example measures opinions instead of accidentally manufacturing them.
Missing Answer Options: Respondents May Not See Their Real Choice
Sample questions
What is your primary reason for choosing our software?
Which department do you work in?
What is your main source of product information?
Why did you visit our website today?
Which subscription plan best fits your needs?
A closed questionnaire only works when people can actually spot their answer in the list, instead of squinting at options that almost fit.
That is the hidden problem with a close ended questionnaire that feels too rigid.
When answer choices are incomplete, respondents often pick the nearest option, even if it is not truly correct.
That can make your results look neat while quietly lowering accuracy, which is a very sneaky kind of chaos.
In a close ended survey questions format, missing options can also push people toward "other" again and again.
If that happens too often, your closed questionnaire starts acting like an open one, except with worse structure and more cleanup.
On top of that, some people will simply quit the survey when none of the answers reflect their real situation.
That matters even more for closed ended questions in research, where missing categories can weaken data quality, reduce validity, and make findings harder to trust.
Incomplete options can force inaccurate responses
Overused "other" answers can signal weak questionnaire design
Missing categories can increase drop-off rates
Poor answer coverage can damage research validity
Why & When to Use
A close ended questionnaire works best when you already know your audience well and can predict the most likely responses.
Here’s the thing, closed ended questions usually perform better in mature research areas than in exploratory studies where new patterns may still pop up.
For a stronger closed ended questionnaire sample, include options like "other," "none of the above," or "not applicable" when they genuinely fit.
That small fix can make a closed ended questionnaire example much more useful, and save your data from wearing shoes two sizes too small.
Research shows that when valid options are missing, respondents may choose inaccurate alternatives, worsening data quality and nonresponse consequences (Taylor & Lynn, 2021).
Oversimplification: Complex Opinions Get Reduced to Simple Metrics
Sample questions
How satisfied are you with your overall experience?
How easy was it to use the platform?
How much do you trust our brand?
How valuable do you find this service?
How likely are you to renew your subscription?
Clean numbers can hide messy thoughts.
A closed questionnaire often turns layered opinions into tidy little scores, which looks helpful until you need to understand what people actually mean.
That is where a close ended questionnaire can get a bit too confident for its own good.
A person might rate your service a 4 out of 5, but still feel frustrated by pricing, love the support team, and only trust the brand in certain situations.
In other words, close ended survey questions can capture direction, but not always depth.
Here’s the thing, a 1 to 5 rating scale may seem precise, yet it can miss mixed feelings, hesitation, or conditional opinions like "I like it, but only for work" or "I trust you, but not with my payment details."
That makes a closed ended questionnaire sample easy to chart, but risky to overread.
A single score can flatten complex experiences
Similar ratings may reflect very different reasons
Clean-looking data can create false confidence
Numbers alone may not explain emotion or motivation
Why & When to Use
A close ended questionnaire works well when you want to track changes over time or compare groups quickly and consistently.
Plus, a closed-ended questionnaire is useful for dashboards, benchmarks, and trends, because spreadsheets love neat rows almost as much as managers do.
But if your topic involves trust, identity, emotion, or complicated decisions, do not let a close ended questionnaire example do all the talking.
On top of that, pairing close ended survey questions with open comments or interviews gives you a fuller picture and keeps those polished numbers from pretending they know everything.
Lower Discovery Value: They Rarely Reveal Unexpected Insights
Sample questions
Which feature matters most to you?
What stopped you from completing your purchase?
Which communication channel do you prefer?
What is your main goal when using our app?
Why did you choose a competitor instead?
Great for confirmation, not so great for surprises.
A closed questionnaire is built to sort answers into neat boxes, which is useful until your audience wants to tell you something you never thought to ask.
That is the catch with a close ended questionnaire: if the right answer choice is missing, the insight often goes missing too.
In a rigid closed questionnaire example, respondents may pick the closest option instead of the true one, and that can hide fresh problems, unmet needs, or new opportunities.
Here’s the thing, close ended survey questions are often weakest when you are still exploring what matters most.
That makes them a real limitation in early-stage product research, customer journey analysis, and audience discovery, where the whole point is to find the unexpected.
New pain points may stay invisible
Emerging customer language may never appear
Hidden objections can get forced into wrong categories
Useful ideas may be lost before you even notice them
A close ended questionnaire sample can look organized and polished, but sometimes it is basically a treasure map with half the island missing.
Why & When to Use
A close ended questionnaire works best when you are testing known ideas, not hunting for unknown ones.
Plus, a closed questionnaire is strongest after interviews, open comments, or exploratory surveys have already revealed the key themes.
On top of that, if you want better answer choices, do the messy discovery work first, then turn those findings into sharper close ended survey questions.

Best Practices for Using Closed Ended Questions Well
Sample questions
Which age range do you belong to?
How often do you use this product?
Which of the following best describes your role?
How satisfied are you with the onboarding process?
Would you purchase from us again?
Good design makes fast data actually useful.
When you build a closed questionnaire, the goal is not just speed. It is getting clean, reliable answers without boxing people into nonsense.
Here’s the thing, even a solid close ended questionnaire can go sideways if your wording is fuzzy or your answer choices overlap like two people trying to sit in one airplane seat.
If you want better results from close ended survey questions, use a simple do-this-not-that approach.
Dos
Do make answer choices mutually exclusive and collectively exhaustive.
Do use neutral wording and balanced scales in every close ended questionnaire.
Do include “other,” “none,” or “not applicable” when the topic calls for it.
Do test your closed ended questionnaire sample with a small group before launch.
Do add selective open follow-ups when context matters.
Do match each question to one clear research goal.
Don’ts
Don’t force people into inaccurate answer choices.
Don’t ask double-barreled questions like asking about speed and quality in one item.
Don’t overload a closed questionnaire with repetitive rating scales.
Don’t assume everyone reads scale points the same way.
Don’t use a closed-ended questionnaire when the topic needs explanation or storytelling.
Don’t treat numbers as the full story without checking for missing context.
Why & When to Use
Best practices matter anytime you create a close ended questionnaire, closed questionnaire, or closed-ended questionnaire for dependable data collection.
Plus, careful design reduces bias, improves completion rates, and turns your results into actions instead of just attractive spreadsheets.
Closed Ended vs Open Ended Questions: When the Tradeoff Matters
Sample questions
Did you complete your purchase today?
Why did you decide not to complete your purchase today?
How satisfied are you with the training program?
What part of the training program needs improvement?
Which feature do you use most, and why?
The best question type is the one that fits your goal, not your habit.
A closed questionnaire works best when you need fast, measurable answers from lots of people.
Open ended questions work better when you need people to explain, describe, or reveal something you did not already expect.
Here’s the thing, this is not a cage match where one format wins forever. A close ended questionnaire is great for counting patterns, while open questions help you understand the reason behind the pattern.
Close ended survey questions are easier to compare, chart, and analyze at scale.
On top of that, a close ended survey keeps completion time shorter, which usually helps you get more responses.
Open ended questions have strengths too, but they come with tradeoffs.
They take longer to answer.
They are slower to analyze.
They are harder to standardize across large groups.
They can lead to lower completion rates.
Plus, the disadvantages of closed ended questions are often acceptable when your research goal is measurement, benchmarking, or trend tracking.
Why & When to Use
Use a closed questionnaire when you want clean data, quick analysis, and clear comparisons.
Use open ended questions when you want discovery, explanation, or unexpected feedback.
Better yet, combine both in a closed-ended questionnaire with a few smart follow-ups, because sometimes the spreadsheet needs a translator.
Turning Survey Insights Into Action
Sample questions
Which survey result deserves immediate follow-up?
Which audience segment reported the lowest satisfaction?
What unanswered question remains after reviewing the data?
Which finding can be validated with interviews or open comments?
What is the next action your team should take based on these results?
Good survey data should move your team, not just decorate a slide deck.
A closed questionnaire gives you clean numbers, but the real value comes from what you do next.
Here’s the thing, percentages and scores are useful, but they are not the whole story.
A close ended questionnaire can show where satisfaction drops, where customers hesitate, or which group responds differently, but it cannot always tell you why.
That is why strong teams look for decision-worthy patterns instead of chasing every shiny percentage like it owes them money.
After reviewing your close ended survey questions, turn the results into action by asking:
What pattern shows up across multiple questions?
Which segment needs attention first?
What business goal does this finding connect to?
What follow-up research would confirm the reason behind the result?
Plus, the best surveys do more than measure opinions.
They help you improve products, refine messaging, strengthen training, upgrade customer experience, or sharpen the next round of research.
Why & When to Use
Use this step after working through a closed ended questionnaire sample or any standardized close-ended questionnaire.
It helps you connect findings to goals, compare segments, and avoid making confident decisions from incomplete answers.
On top of that, if your closed questionnaire delivers clear numbers but unclear reasons, the next move is follow-up research, not guesswork.
Related Question Design Surveys
29 Quantitative Survey Research Questions Examples
Explore 25 sample quantitative survey research questions and survey questions example to guide re...
31 Good Survey Questions for Better Feedback
Explore 25 good survey questions to boost response quality, gather insights, and improve feedback...
29 Survey Questions Mistakes
Discover 25 survey questions mistakes with sample questions and expert tips to improve responses,...