31 Attitudinal Survey Questions for Better Insights
Explore 25 sample attitudinal survey questions to measure opinions, satisfaction, and behavior in research, plus practical examples.
Attitudes are slippery little things, but they drive a huge share of what customers do next. An attitude survey helps you capture opinions, emotions, preferences, and beliefs, while behavioral data shows what people actually did, like clicking, buying, renewing, or leaving. Both matter, but attitudinal data explains the “why” behind the action. If you have searched for an attitude survey, an attitudinal survey template, or simple attitude questions examples, you are really looking for better ways to hear what people mean, not just what they did. This article walks you through eight practical attitudinal question formats that help with product-market fit, CX benchmarking, employee engagement, and brand perception.
Likert-Scale Attitude Surveys
Why & When to Use
Likert-scale questions are the workhorse of the attitude survey world, and yes, they earn that boringly heroic title.
When you want to measure intensity, not just direction, this format gives you clean and useful detail.
You can ask how strongly someone agrees, how often they feel a certain way, or how important something is to them.
That makes Likert items ideal when your goal is to track changes over time.
If you run monthly pulse checks, post-release feedback surveys, or quarterly customer sentiment studies, this format plays very nicely with trend analysis.
You can compare this month to last month without needing a decoder ring.
Likert-style attitudinal questions also work well because they are familiar.
Most people understand a five-point or seven-point scale right away, which means less confusion and fewer messy answers.
That ease matters if you are surveying busy customers, distracted employees, or anyone filling out your survey while reheating leftovers.
Here’s the thing, this format is strongest when you need consistency.
If your product team wants to know whether confidence in a feature is rising, or your CX team wants to monitor satisfaction with support, Likert items let you measure movement with precision.
They are especially useful in longitudinal attitude surveys because the structure stays stable while the responses evolve.
Use them when you want to measure:
Agreement with statements.
Frequency of feelings or experiences.
Importance of product or service attributes.
Satisfaction with a process or touchpoint.
Likelihood or intention tied to a future action.
On top of that, Likert scales help you turn fuzzy feelings into patterns you can actually analyze.
You can segment by customer type, compare regions, or see whether power users feel differently from new users.
That is where attitudinal data starts becoming useful instead of decorative.
Sample Questions
How strongly do you agree that our new dashboard is easy to navigate?
How often do you feel confident using Feature X without support?
Rate the importance of data privacy in your decision to purchase.
Indicate your level of satisfaction with our response time.
How likely is it that you will renew your subscription next year?
Likert items are simple, flexible, and reliable, which is why they appear in so many good survey questions.
If you want one format that can handle quick pulses and long-term tracking without throwing a tantrum, this is often your best bet.
Likert-type items remain popular for measuring attitudes, but reviews emphasize simple, familiar wording and consistent scale presentation to improve validity and comparability (source).

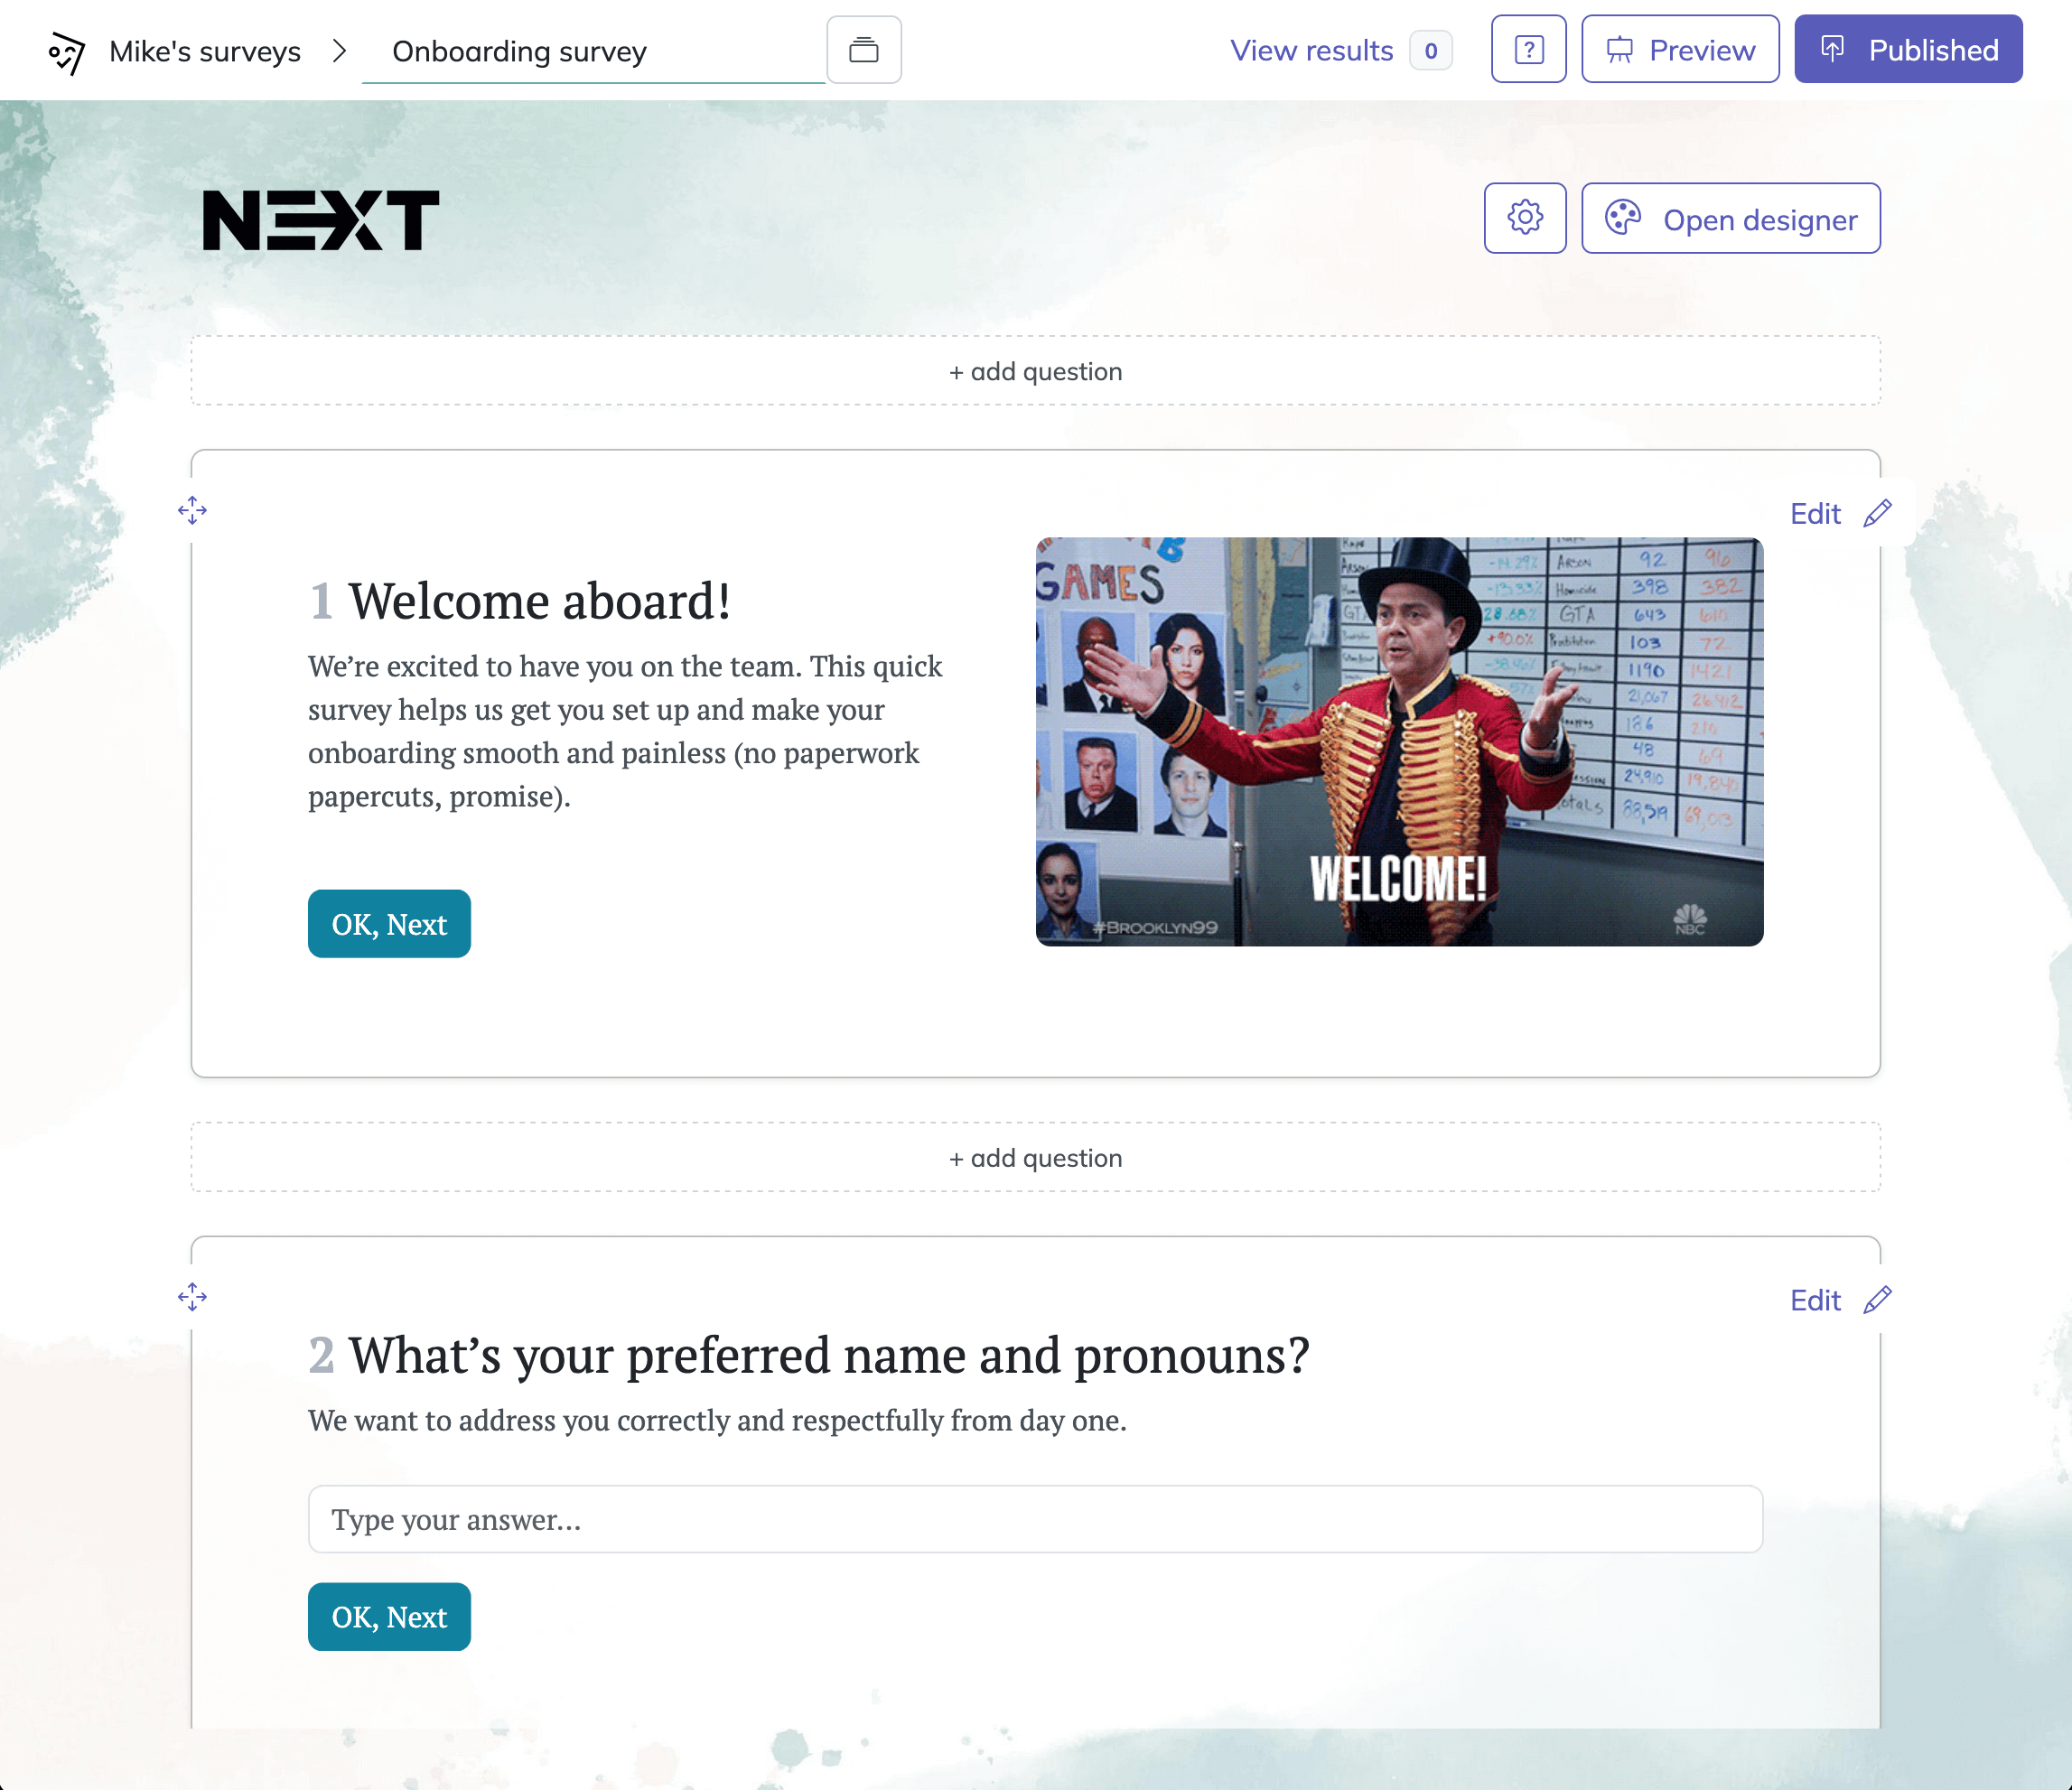
How to create a survey in HeySurvey
1. Create a new survey
Start by opening a template below, or choose to begin from scratch if you want full control. HeySurvey lets you start without an account, so you can explore the editor first. Once your survey opens, you’ll see the Survey Editor, where you can give your survey an internal name and begin shaping it. If you are using a template, it already gives you a ready-made structure that you can edit to match your needs.
2. Add questions
Click Add Question to insert new questions into your survey. HeySurvey supports many question types, including text, multiple choice, scale, number, date, dropdown, file upload, and statement blocks. You can make any question required, add descriptions, include images, and duplicate questions to save time. If needed, you can also set up branching so respondents are taken to different questions based on their answers. This is useful when you want a survey to feel more personal and relevant.
Bonus steps: apply branding and settings
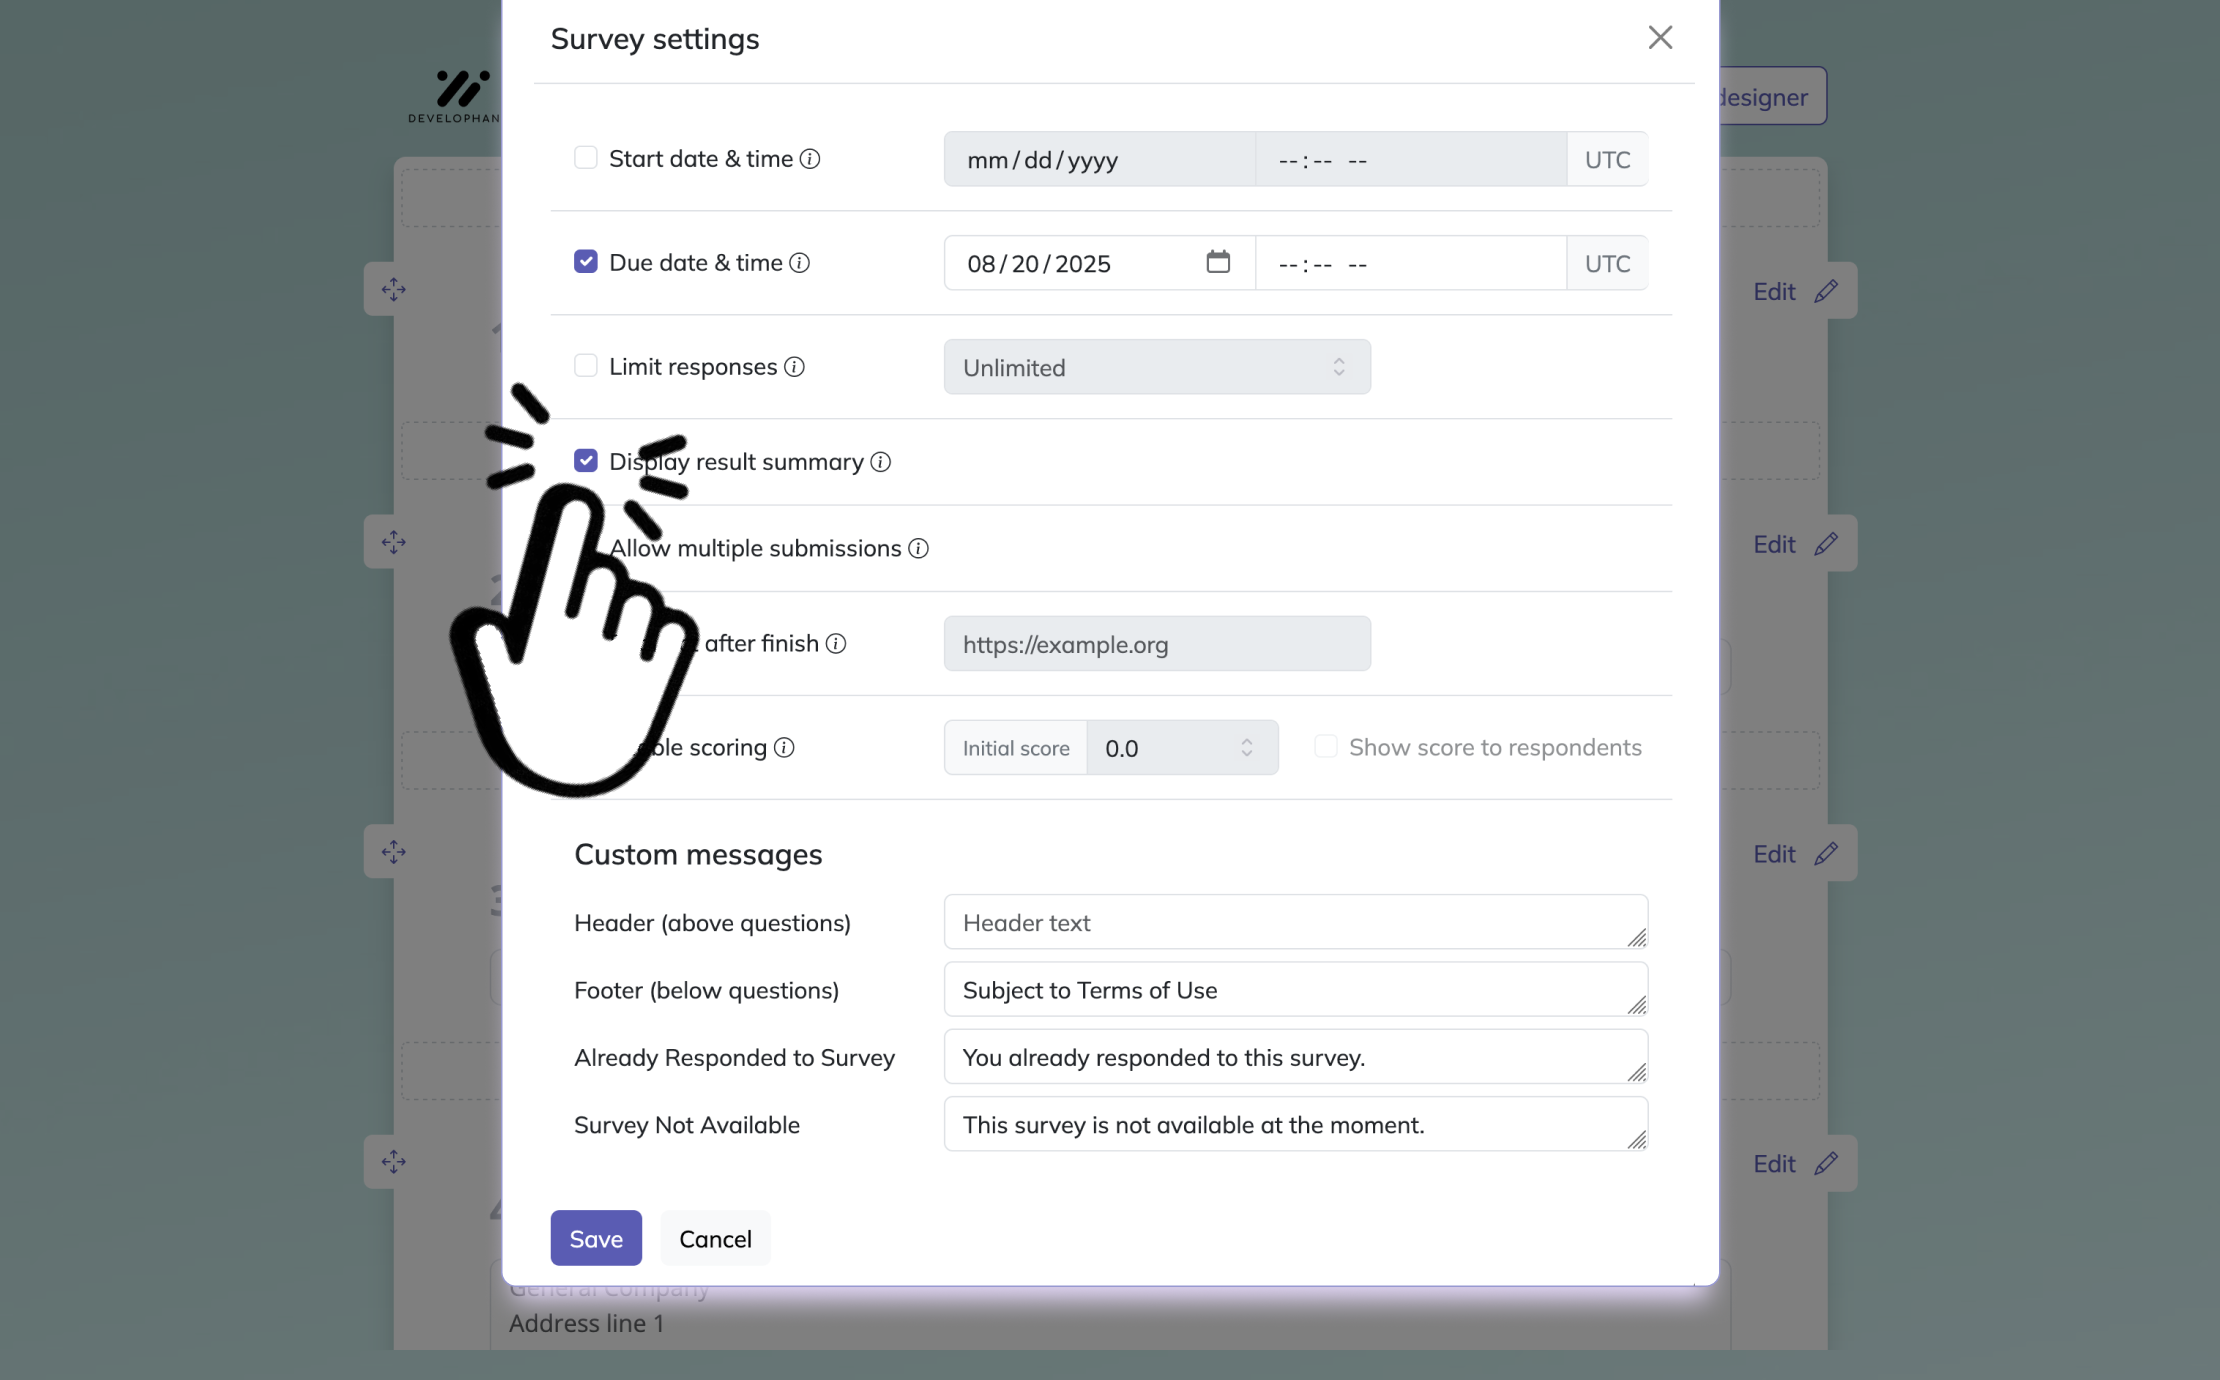
Before publishing, you can customize the look and feel of your survey. Add your logo, change colors and fonts in the Designer Sidebar, and adjust backgrounds or layouts. You can also define settings such as start and end dates, response limits, redirect URLs, and whether respondents can view results. If your survey has different paths, make sure branches and endings are set correctly.
3. Publish survey
When everything looks right, click Preview to test the survey, then Publish to make it live. Publishing creates a shareable link you can send to respondents or embed on your website. After publishing, you can return anytime to view results and manage your online survey tool
Semantic Differential (Bi-Polar Scale) Surveys
Why & When to Use
Semantic differential scales are excellent when you want to understand how people place your brand, product, or experience between two opposite ideas.
Instead of asking whether someone agrees with a statement, you ask where they land on a spectrum like modern to outdated, clear to confusing, or trustworthy to unreliable.
That shift matters because it captures emotional positioning in a more textured way.
A customer may not strongly agree that your app is “good,” but they can absolutely tell you whether it feels effortless or frustrating.
This is why semantic differential scales are so useful in concept testing and brand perception work.
If you are comparing packaging directions, onboarding flows, website designs, or advertising messages, this format helps reveal the personality respondents assign to each option.
It is a smart fit for an exploratory attitudinal survey template because it gives you nuance without requiring a wall of open text.
Plus, it lets you see whether your intended brand image matches the one living rent-free in your audience’s head.
This question type is especially valuable when you want to measure perception, tone, and emotional impression.
That includes areas like:
Brand personality.
Product usability feel.
Service tone.
Visual design perception.
Purchase experience clarity.
You can also use it before and after a rebrand, feature redesign, or campaign launch.
If your team says, “We want the brand to feel more premium and approachable,” this is one of the cleanest ways to test whether that actually happened.
Because yes, “premium but friendly” sounds nice in a meeting, but respondents are the ones who decide if it is true.
Sample Questions
Our mobile app feels: 1 = Complicated … 7 = Effortless.
Customer support was: 1 = Disrespectful … 7 = Respectful.
The design style is: 1 = Traditional … 7 = Cutting-edge.
Payment process is: 1 = Confusing … 7 = Clear.
Overall brand image: 1 = Unreliable … 7 = Trustworthy.
These attitudinal questions are particularly helpful when standard rating scales feel too blunt.
If you need richer signal on brand or product positioning, semantic differential items can tell you not just whether people like you, but what kind of “you” they think you are.
Semantic differential scales are widely used to measure attitudes by capturing respondents’ connotative meanings between bipolar adjectives like good–bad or trustworthy–unreliable (source)
Net Promoter Score (Single-Item Loyalty Attitude)
Why & When to Use
Net Promoter Score is the quick, tidy, slightly famous cousin of the broader attitude survey family.
It is widely used because it gives you a fast read on loyalty and advocacy, and it is easy to benchmark over time.
The classic question asks how likely someone is to recommend your company to a friend or colleague.
That single item works because recommendation intent often reflects a mix of trust, satisfaction, and emotional commitment.
In other words, it is not just about liking your service.
It is about whether a customer feels confident attaching their own reputation to it, which is a much bigger deal.
If they recommend you, they are basically saying, “I trust you enough to risk being texted about it later.”
NPS fits neatly into post-purchase surveys, quarterly relationship studies, and account health checks.
It is especially useful when you need one headline metric that executives can understand quickly.
That does not mean it should stand alone forever, though.
The strongest use of NPS comes when you pair it with follow-up attitudinal questions that uncover the reasons behind the number.
Use this format when you need:
A fast loyalty snapshot.
A benchmarkable KPI across teams or periods.
A simple post-transaction measure.
A recurring pulse for customer advocacy.
An entry point into deeper qualitative feedback.
On top of that, NPS helps teams align.
Marketing, customer success, product, and leadership can all understand a movement in promoter or detractor share, especially when it is tied to comments and behavior.
That is where attitudinal data becomes more actionable and less poster-friendly.
Sample Questions
How likely are you to recommend us to a friend or colleague?
What is the primary reason for your score?
How likely are you to discourage others from using our service?
How likely are you to recommend our competitors instead?
How likely are you to upgrade your current plan?
The classic NPS item is simple, but the real value comes from what surrounds it.
If you use it thoughtfully inside a wider attitude survey, it can become a strong signal of loyalty rather than just a lonely number on a dashboard.
Ranking & Prioritization Attitude Questions
Why & When to Use
Ranking questions force people to make choices, and that is exactly why they are so useful.
In many attitude surveys, respondents will happily say that everything is important, valuable, urgent, and deeply meaningful.
That is nice for morale, but not very helpful for decision-making.
A ranking format removes the safety blanket and asks respondents to show what matters most.
This is especially powerful in product planning, message testing, pricing research, and value proposition work.
If you need to know which feature customers care about first, which benefit drives purchase, or which brand value matters most, ranking exposes real trade-offs.
That makes it perfect for questionnaires focused on values, desires, and attitude typology.
Here’s the thing, people live with trade-offs every day.
They choose speed over cost, privacy over convenience, premium design over budget pricing, and sometimes free shipping over nearly everything else.
When your attitudinal questions reflect those choices, your results become much more realistic.
Use ranking when you need clarity on:
Feature priorities.
Benefit hierarchy.
Price acceptance order.
Value or mission alignment.
Brand expectation preferences.
This question type is valuable because it supports prioritization directly.
You can feed the results into product roadmaps, positioning decisions, or service improvements without needing much interpretation.
Plus, it can expose mismatches between what your team thinks customers value and what customers actually rank first.
That moment can sting a little, but useful research often does.
Sample Questions
Rank these features 1-5 from most to least valuable.
Place the following company values in order of importance to you.
Order these shipping options by preference.
Rank potential price points from most acceptable to least.
Prioritize the social causes you expect brands to support.
Ranking items can be demanding, so use them carefully.
If your list is too long, respondents get tired fast, and tired respondents are basically tiny chaos generators.
Still, when you need a true order of preference, few formats reveal priorities better.
Qualtrics notes ranking becomes difficult beyond about seven items, so best-worst tradeoff formats often produce clearer prioritization data in attitudinal surveys (source)
Agreement/Disagreement Matrix (Grid)
Why & When to Use
Agreement matrices are efficient because they let you measure reactions to multiple statements using the same response scale.
Instead of asking five separate questions with five separate sets of buttons, you place several statements in one grid and ask respondents to rate each one.
That saves space and keeps the survey moving, which is great when you have a lot to measure.
This format is particularly useful in employee attitude surveys, internal engagement studies, and diagnostic assessments.
If you need to understand how people feel about recognition, leadership, workload, communication, values, and belonging, a grid helps you gather broad sentiment quickly.
It is the survey equivalent of packing neatly for a trip instead of sitting on your suitcase and hoping for the best.
That said, grids work best when they are short, clear, and mobile-friendly.
If the statements are too long or the matrix too wide, respondents can lose track of where they are.
Then your beautiful design turns into accidental finger gymnastics.
Still, for structured attitude survey questions that track multiple dimensions at once, this format can be extremely effective.
Use it when you want to assess:
Workplace engagement.
Internal communication.
Team climate.
Organizational trust.
Multi-item customer satisfaction dimensions.
On top of that, matrix questions make comparison easy.
You can immediately see which statements score highest, which ones lag, and where attention is needed.
That is why they are a staple for repeated studies and diagnostics built around attitudinal data.
Sample Questions
Management communicates changes effectively.
I feel recognized for my work.
The company lives its stated values.
My workload is manageable.
I would recommend this workplace to others.
Each of these would appear as a statement in the grid, rated on a consistent scale such as strongly disagree to strongly agree.
Used well, this format gives you efficient coverage without sacrificing analytical value, which is a nice trick for any survey design.
Check-All-That-Apply (CATA) Attitudinal Assessment
Why & When to Use
Check-all-that-apply questions are useful when you want breadth rather than depth.
Instead of forcing respondents to rank, rate, or fully explain every feeling, you give them a list and let them select all options that fit.
That makes this format great for early exploration, especially when you are trying to understand perceptions, emotions, associations, or decision drivers.
In an attitude survey, CATA questions can reveal which words, benefits, concerns, or beliefs cluster around your brand or experience.
This format is less restrictive than ranking and less demanding than open-ended responses.
That means respondents can move quickly, which reduces fatigue and improves completion rates.
Plus, if your goal is to map the landscape before designing a more detailed attitudinal survey, CATA gives you a broad first read.
It is particularly handy when you are working on brand perception, checkout experience, cancellation feedback, or feature adoption.
You can gather useful directional insight without asking people to write mini essays while balancing a phone in one hand.
Use CATA when you need to learn:
Which emotions were present.
Which brand traits are associated with you.
Which motivations influenced a decision.
Which benefits matter to different segments.
Which claims or themes people connect to your brand.
Here’s the thing, CATA is not ideal if you need intensity.
It shows what applies, but not how strongly it applies.
Still, when used early in a research process, it can help you shape better follow-up attitudinal questions later.
Sample Questions
Which words describe our coffee brand? Select all that apply.
Which emotions did you feel during checkout?
Which reasons influenced your decision to cancel?
Which of the following sustainability claims do you associate with us?
Which benefits motivated you to upgrade?
This format works best when your answer list is balanced, clear, and not absurdly long.
If respondents need to scroll through forty options, you are no longer running a survey, you are assigning homework.
Exploratory Open-Ended Attitudinal Questions
Why & When to Use
Open-ended questions are where you go when you want the real words, the messy details, and the insights no scale can predict.
They are especially useful at the beginning of a project, when you do not yet know the full range of beliefs, emotions, or motivations shaping customer attitudes.
Before you build a polished attitude survey, open-ended responses can show you what language people naturally use.
That matters because good survey design starts with how respondents think, not just how analysts sort rows in a spreadsheet.
If you are updating an exploratory attitudinal survey template, this format can help you discover what deserves to become a future scale, matrix, or ranking item.
Open-ended prompts are also valuable when you suspect there are hidden drivers behind behavior.
A customer may cancel for “price,” but the actual issue could be confusion, unmet expectations, weak onboarding, or a feeling that the product is not built for someone like them.
That is why qualitative attitudinal data often gives context that structured scales cannot.
Use open-ended items when you want to uncover:
Unexpected themes.
Emotional language.
Decision-making logic.
Personal values and motivations.
New segments within an attitude typology.
Plus, these questions can be powerful for brand work.
The exact phrases customers use to describe your company can sharpen your messaging, clarify your positioning, and expose disconnects between your intent and their reality.
Sometimes one honest sentence tells you more than twenty ratings ever could, which is both inspiring and mildly rude to the ratings.
Sample Questions
What first comes to mind when you think of our brand?
Describe a recent moment when our product delighted or frustrated you.
What personal value does our service satisfy?
How would you improve our onboarding experience?
Tell us why you chose us over alternatives.
The key is not to overdo it.
A few strong open-ended attitude survey questions can produce rich insight, but too many will slow respondents down and lower completion.
Use them with purpose, and they can become the smartest part of your survey.
Best Practices: Dos and Don’ts for Attitudinal Survey Design
What to Do
Good survey design habits matter just as much as the question type you choose.
A smart set of attitude survey questions can still fail if the scales are inconsistent, the wording is biased, or the mobile experience is clunky.
That is why the basics are not glamorous, but they are mission-critical.
Keep scales consistent whenever possible.
If one question uses strongly disagree to strongly agree, and the next flips direction or changes the labels without warning, respondents get confused.
Confused respondents are not giving you insight, they are just clicking through a tiny maze.
Randomize answer options when order might bias the result.
Pre-test your survey with a small group before launch.
Combine attitudinal data with behavioral data whenever you can, because what people say and what they do are often related, but not identical.
And close the feedback loop by sharing what you learned or what changed as a result.
That step builds trust and can improve response quality in future attitude surveys.
Helpful practices include:
Keep response scales uniform across similar questions.
Randomize options where order effects are possible.
Test wording for clarity and bias before launch.
Use behavioral data to enrich interpretation.
Follow up on findings with visible action.
What to Avoid
Do not overload the survey with jargon, internal language, or fancy phrasing that sounds clever in a meeting and weird everywhere else.
Do not mix positive and negative wording inside the same scale unless you have a very strong reason, because it increases mistakes and muddies your data.
Ignore mobile formatting at your peril, since many respondents answer on phones.
And never force answers on sensitive topics if a skip or “prefer not to say” option is more respectful.
Here’s the thing, the best attitudinal survey feels easy for the respondent and useful for you.
If it feels annoying, confusing, or longer than a Monday afternoon, the design needs work.
When you write and structure surveys with care, you get cleaner insight and far fewer regrets.
The right question type gives you the shape of customer opinion, but great survey design gives you the truth inside it. If you use Likert scales, semantic differentials, NPS, ranking, grids, CATA, and open-ended prompts with clear intent, your attitude survey becomes far more than a box-ticking exercise. You start to capture mindset, motivation, and meaning in ways that help product, CX, brand, and people teams act with confidence. That is the real power of attitudinal questions. And yes, it is much more useful than guessing what customers meant from a mysterious thumbs-up alone.
Best Practices, Dos & Don’ts for Crafting Attitudinal Survey Questions
Even the best format can flop if the questions themselves are a mess. Crafting effective attitudinal survey questions takes equal parts science and common sense. Neutrality is your friend—never lead respondents by sneaking in your opinion. Always avoid double-barreled items (“Did you find the website fast and easy?”—pick one, please!).
Keep scale length appropriate. Five to seven points work for most, but don’t go overboard unless your data needs demand it. Embrace mobile-first design and clean visual layout, since more people answer surveys on their phones these days. Randomize answer orders to banish order bias and straight-lining.
- Keep question wording clear, simple, and jargon-free
- Use balanced response options (not all positive or negative)
- Write with inclusive language; avoid stereotypes
- Pilot test your survey for reliability (think: Cronbach’s alpha) and clarity
- Consider sample size for valid analysis—bigger is often better
Don’t:
- Use leading or biased phrases (“Don’t you agree…?” spells trouble)
- Crowd your survey with too many open-ends (write-ins are tiring)
- Get carried away with complicated, academic words
- Forget to check for cultural fit—what’s polite in one language may be rude in another
- Let a single response scale dominate (variety reduces fatigue)
For data analysis, think before you leap: means work for interval scales; medians shine with skewed data; top-box scoring uncovers true raves. Always check your coding—garbage in, garbage out!
Conclusion
Attitudinal survey questions are the secret weapon behind powerful insights into beliefs, preferences, and drives. Mastering their variety lets you pinpoint what makes people tick, whether they’re buying, voting, or joining. The right format makes your data clearer, your research sharper, and your decisions smarter. So mix, match, and experiment—your next survey’s “aha!” moment is just a question away.
Related Question Design Surveys
29 Quantitative Survey Research Questions Examples
Explore 25 sample quantitative survey research questions and survey questions example to guide re...
31 Good Survey Questions for Better Feedback
Explore 25 good survey questions to boost response quality, gather insights, and improve feedback...
29 Survey Questions Mistakes
Discover 25 survey questions mistakes with sample questions and expert tips to improve responses,...